The Morning Glory and related phenomena
The phenomenon
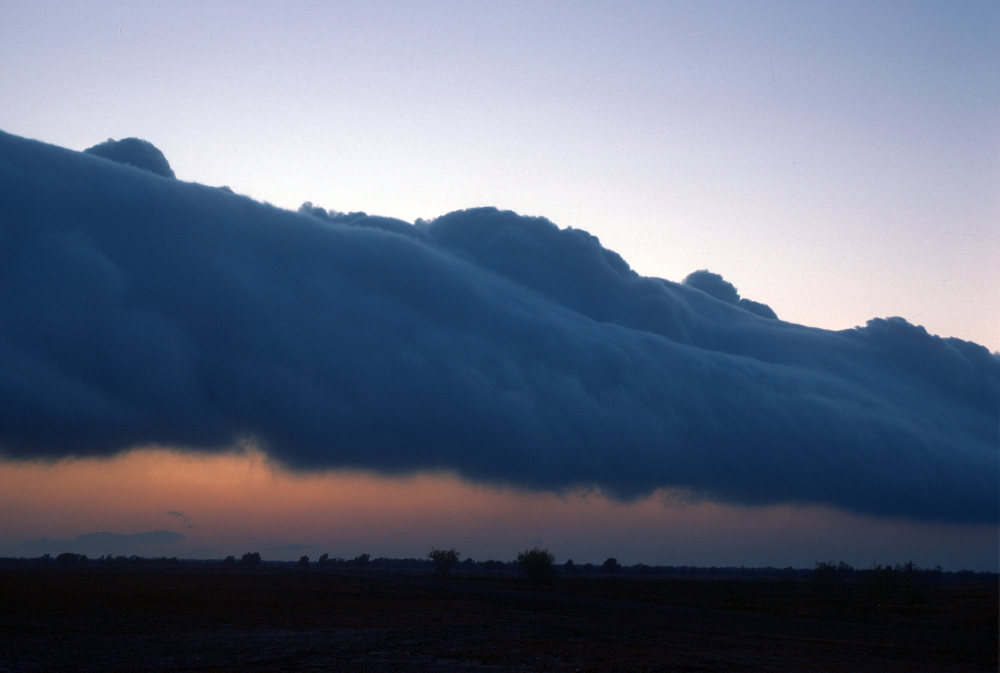
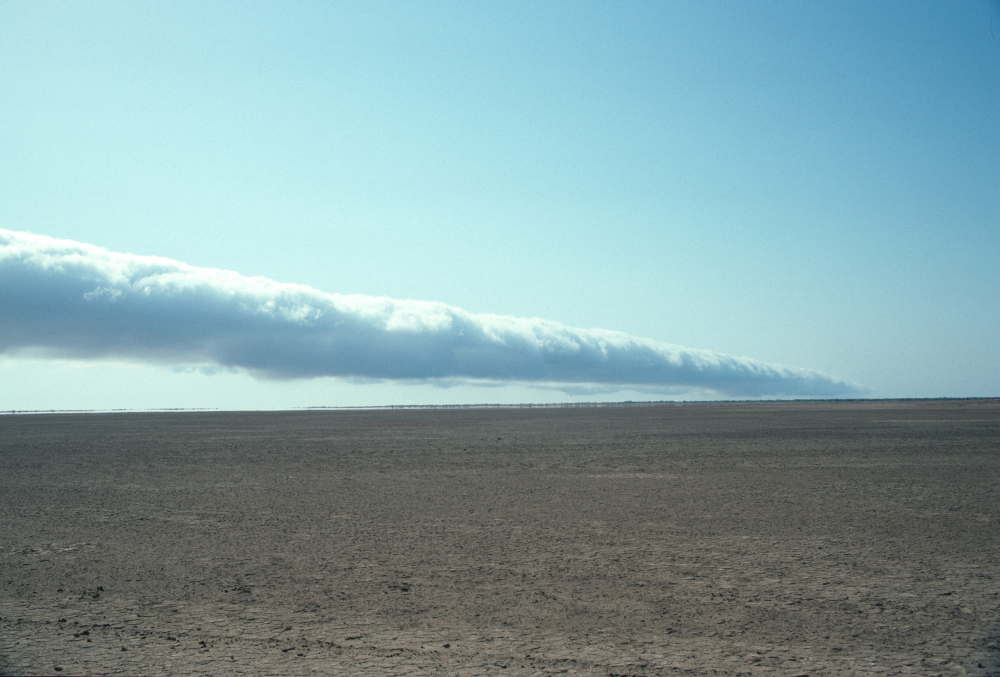
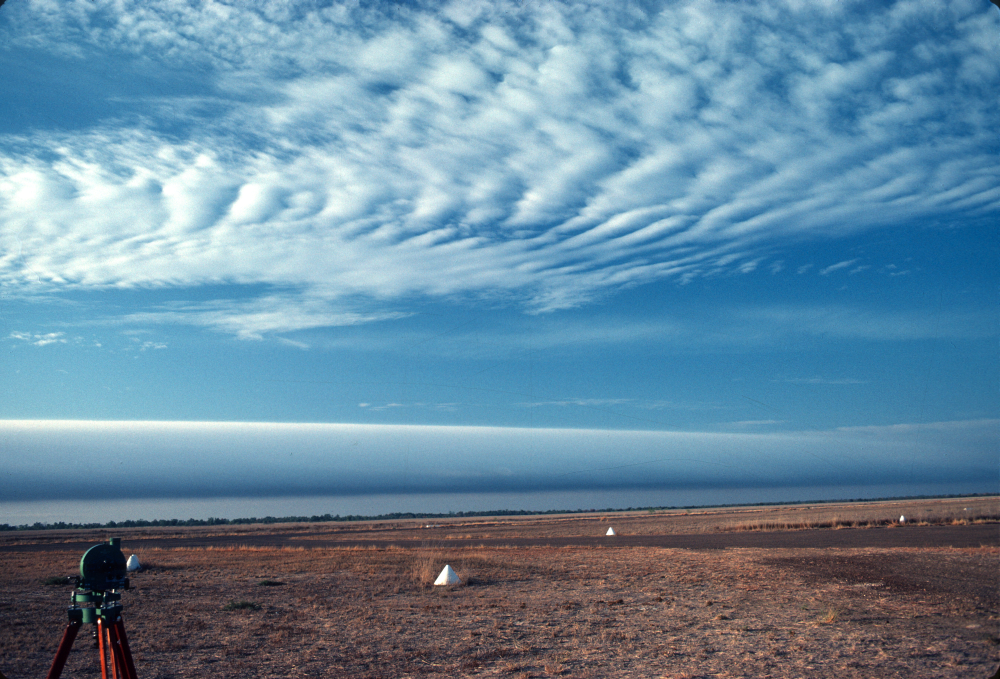
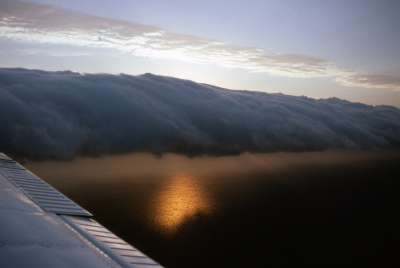
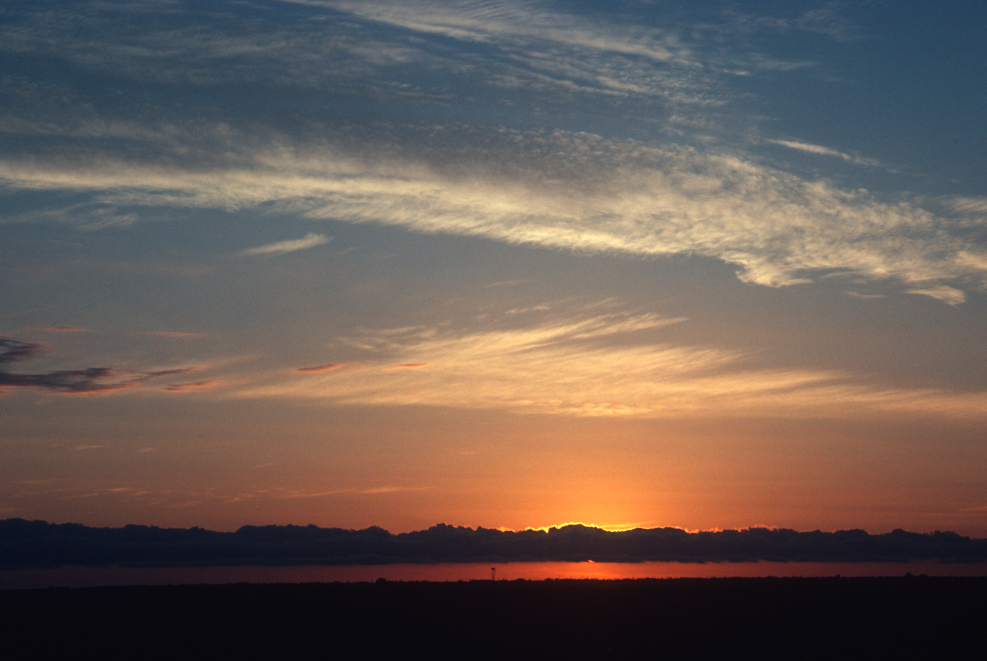
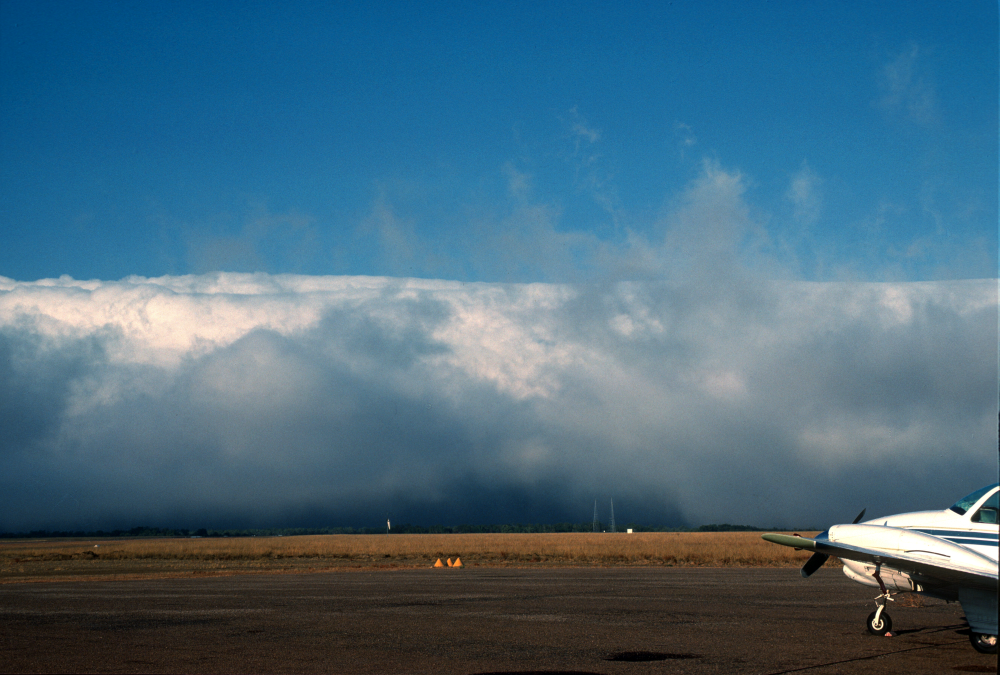
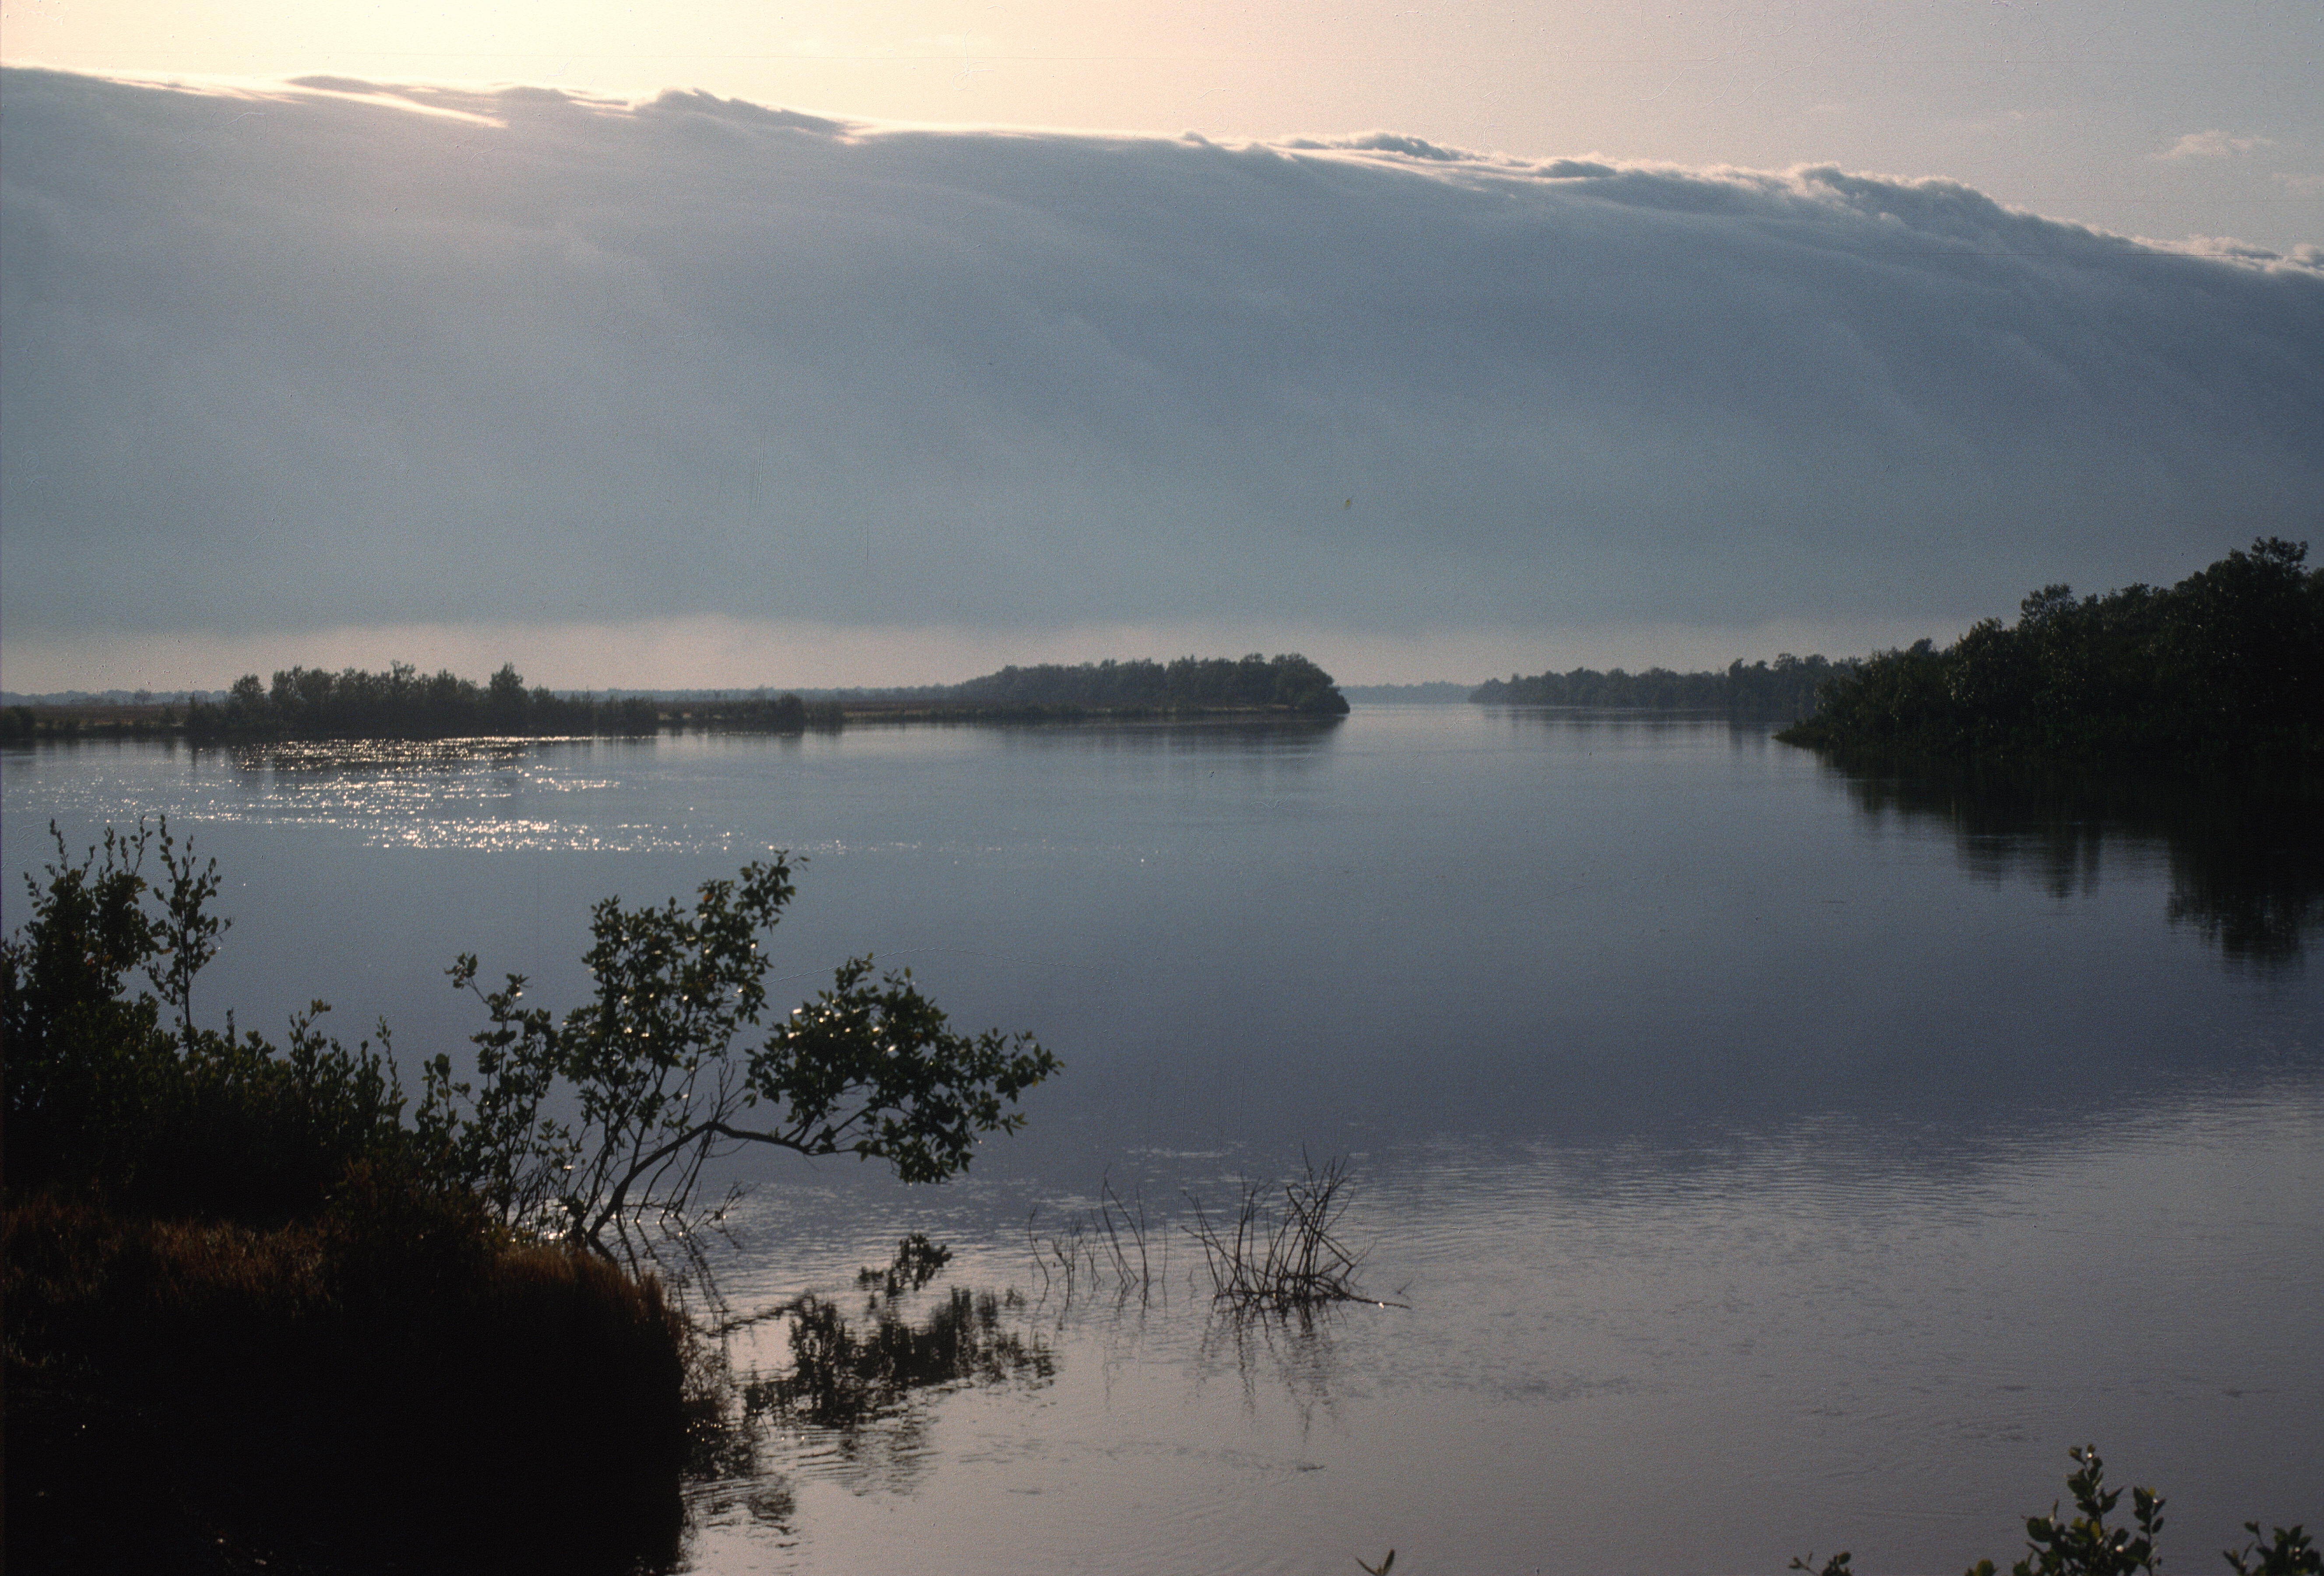
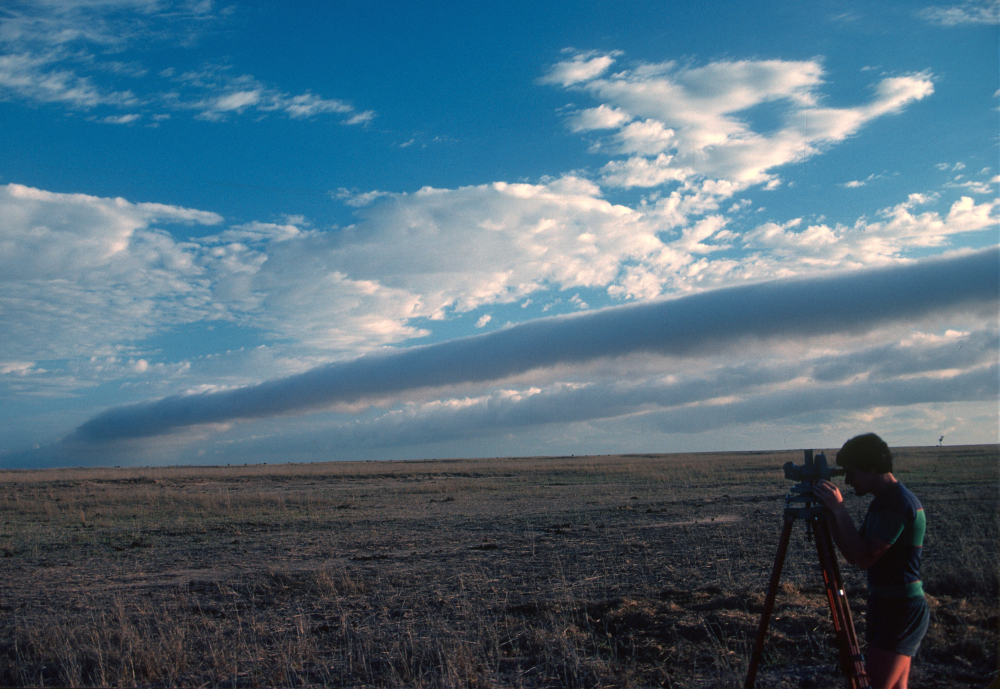
Morning Glory is the name given to a spectacular cloud formation that occurs in the Gulf of Carpentaria region of northeastern Australia. It is composed of a low roll cloud or often a succession of roll clouds, sometimes stretching from horizon to horizon. The clouds are seen early in the morning, most frequently towards the end of the late dry season from early September to about mid-November. They are typically 1 or 2 km in width, 1 km deep, and may be 100 km or more long, with cloud bases often no more than 100 or 200 m high. Occasionally they are preceded over land by a shallow layer of fog that they rapidly disperse. They move rapidly across the sky at speeds of 10-15 m s-1, the most usual direction being toward the southwest, although cloud lines orientated approximately east-west and moving from the south are sometimes observed. The passage of each cloud overhead is usually accompanied by the onset of a sudden wind squall which, although normally of short duration (perhaps 5 to 10 minutes), have wind speeds comparable to the speed of the cloud. The disturbance brings about also an abrupt rise in surface pressure (sometimes more than 1 mb in a few minutes and a reversal in surface wind direction. The surface pressure may oscillate following the rise, but the increased mean pressure and change in wind direction frequently persist for at least several hours. Some examples are shown in Figure 1. A typical surface pressure trace is shown in Fig. 2.
 (a) (a)
 (d) (d)
 (g) (g)
 (j) (j)
|
 (b) (b)
 (e) (e)
 (h) (h)
 (k) (k)
|
 (c) (c)
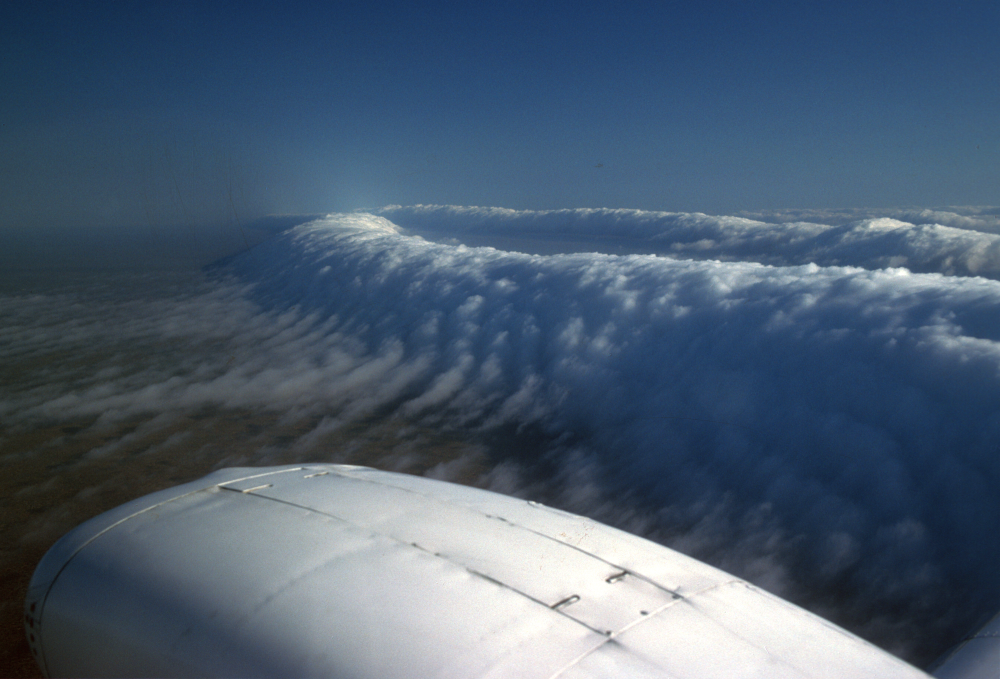 (f) (f)
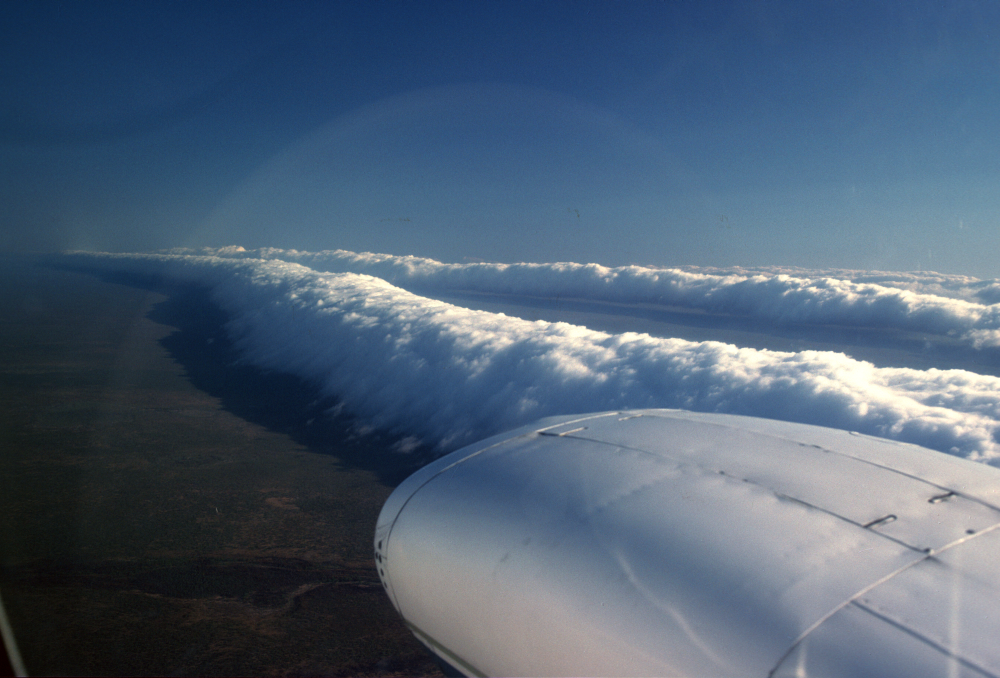 (i) (i)
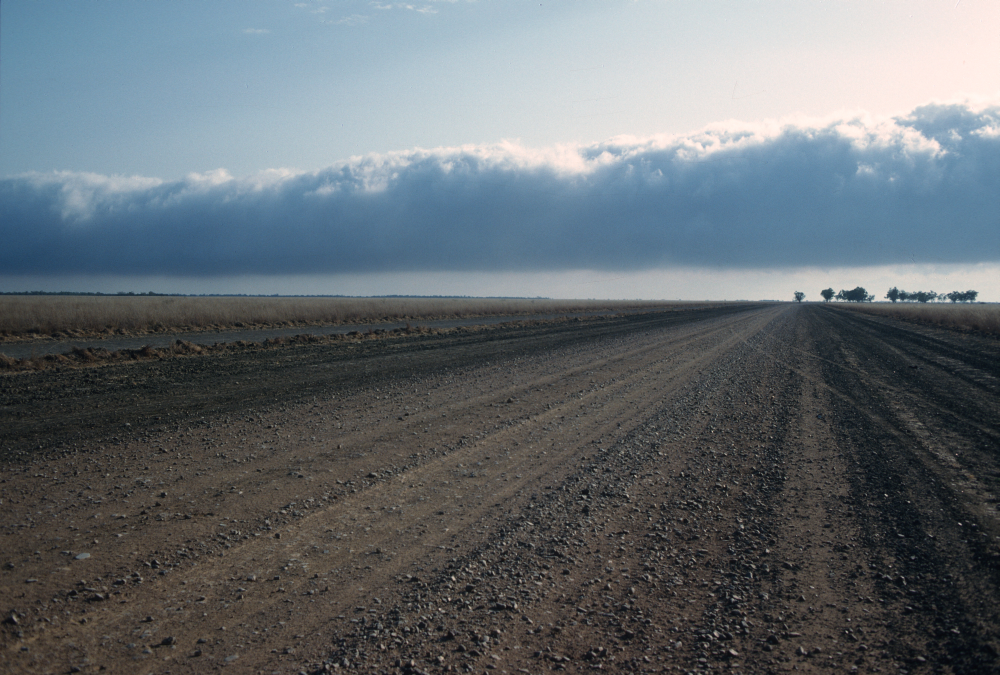 (l) (l)
|
 (a) (a)
|
 (b) (b)
|
History
Anthropologist Dr. Margaret Moore told us that the name of the phenomenon in the language of the Garrawa Aboriginal people who live near the south coast of the Gulf is "kangolgi" and it is credited with increasing the supply of bird life. This may reflect the fact that the morning glory occurs most frequently in October, just prior to the "wet" season, which is a harbinger of bounty for the Aborigines.
The earliest published description of the morning glory that we are aware of is in the Royal Australian Air Force (1942, Part 2, p. 25), where it is described as a "land breeze" coming out of the east about dawn with a squally onset and with one or several long straight lines of low cloud. Thirty years later, Clarke (1972) explored the possibility that the phenomenon could be interpreted as a propagating internal hydraulic jump, formed at a discontinuity in the slope of the ground, on a katabatic flow developing on Cape York Peninsula. Clarke's theory was inevitably tentative, since the only available data against which it could be compared were a series of autographic records of surface pressure, wind and temperature at the (now abandoned) weather station at Karumba. Moreover the theory did not take account of the strong heating contrasts between sea and land in the Gulf region. In fact, there appeared to be the possibility that local sea breeze circulations might be a more important influence than the katabatic flow.
A few years later, Neal et al. (1977) carried out a study of pressure jumps recorded on weekly Bureau of Meteorology barographs around the gulf at Edward River, Kowanyana, Normanton, Burketown and Mornington Island. These data enable estimates to be made of the speed and orientation of a number of pressure jump "lines", presumably associated with morning glories. It was shown that the majority of lines were roughly parallel with the east coast of the Peninsula (and also to the coastal ranges which rise to a height of between 300 and 500 m in the Dividing Range) and move with a speed of typically 10 m s-1.
A climatology of pressure jumps was presented also, showing frequencies of occurrence at the five stations in terms of time of day and month, and mean synoptic mean sea level isobaric charts for pressure jump days and for days free of jumps. The latter were classified according to whether surface winds were southeasterly or northeasterly in the southeast gulf area. However, the isobars for northeasterly days without jumps are virtually indistinguishable from those with jumps.
In October 1978, Dr. Reg Clarke, a former research scientist with the then CSIRO Division of Atmospheric Physics, and his wife, Elsje, staged a small expedition to the gulf with a view to collecting more detailed surface data on morning glories as well as photographs and time-lapse movie film of the clouds. Ten days were spent in the field during which time four glories were observed, a frequency which, coincidentally, corresponded with the average frequency of presumed morning glories at Karumba in October, based on nine years of data (Neal et al. 1977: see below). Two of these four occurred before daybreak; one was cloud-free; two had five parallel cloud bands and the other three. All had marked wind and pressure jumps. One was followed by car over 35 km and its speed measured at 11 m s-1; another was photographed in time-lapse which revealed a rolling motion of the cloud band with upward motion at the leading edge and downward motion at the rear. In each case, measurements of surface pressure, temperature, humidity and wind were made during the passage of the disturbance.
The first field experiment
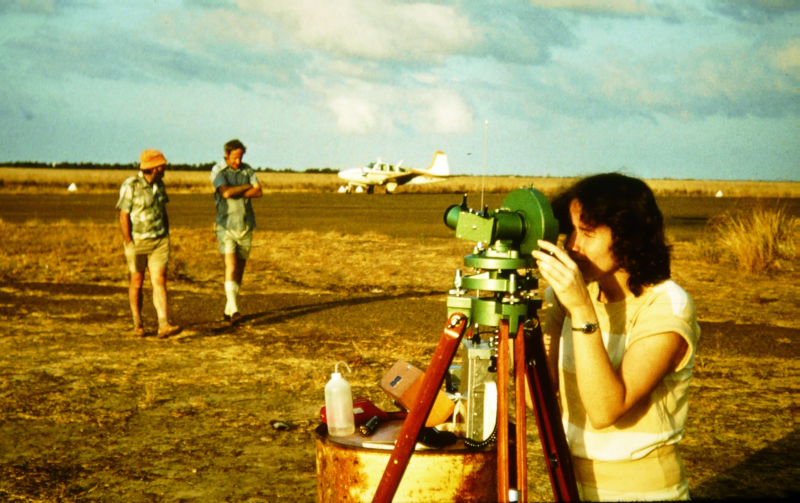
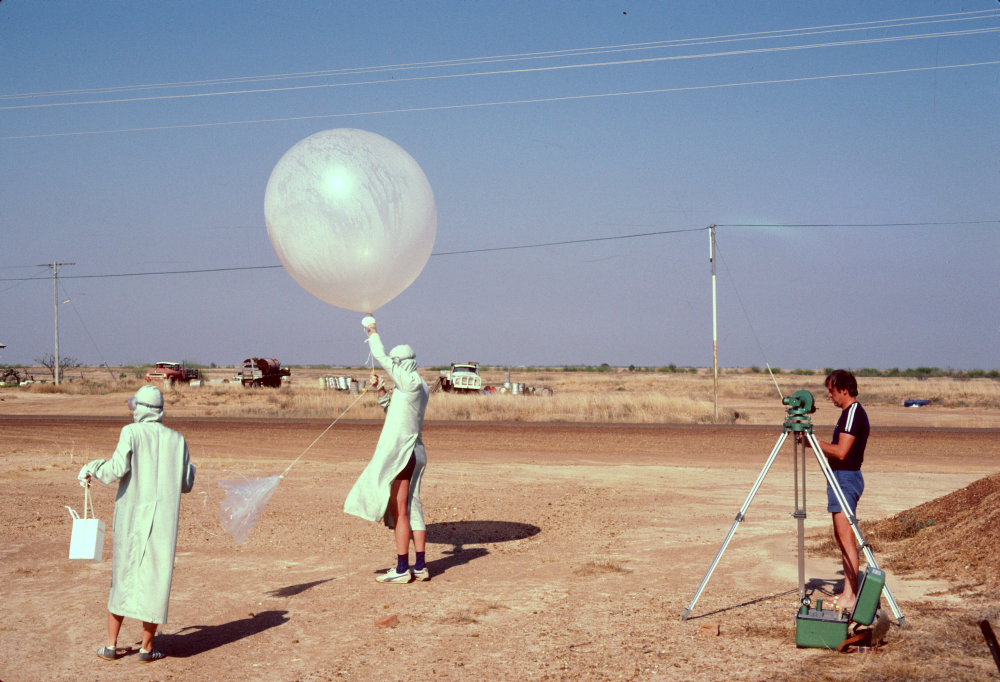
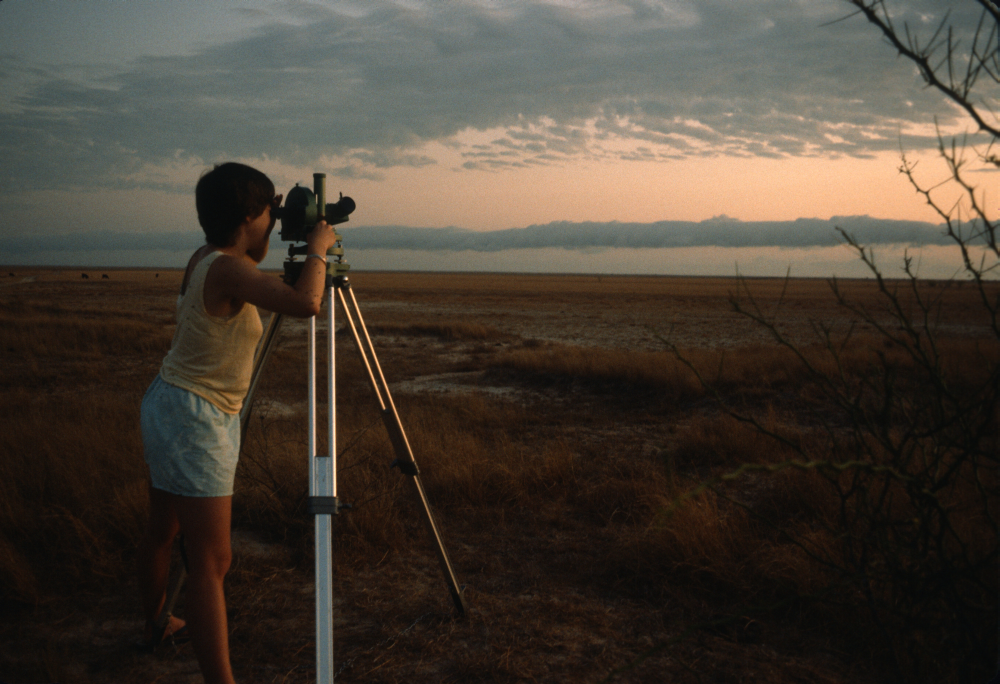
Early in 1979, a more ambitious expedition was planned, led by Reg. Clarke and myself (Roger Smith), with six other participants (Figure 3). It had two main objectives. The first was to observe the structure of morning glories as they passed Burketown, with a view to identifying the mechanisms associated with their propagation and maintenance. The second objective was to obtain surface data on Cape York Peninsula, believed to be the source region, in an attempt to identify the source and to understand the formation mechanism of the phenomenon. To accomplish the first of these tasks, the expedition was equipped with theodolites for making pilot balloon wind measurements and a light aircraft to make airborne measurements of temperature and humidity. The expedition lasted two weeks (23 September - 8 October 1979) during which time three morning glories occurred at Burketown - at 0546 LST on 29 September, at 0700 LST on 3 October and at 0935 LST on 4 October. An unprecedented amount of data was collected on these events and their subsequent analysis, together with the data collected on the peninsula. was presented in a paper by Clarke et al. (1981). A brief description of the experiment was given by Smith and Goodfield (1981). A disturbance was observed also on the morning of 6 October as the expedition party was about to leave Burketown, but no data were obtained, only photographs. An intriguing feature of this disturbance was that unlike the others, it was moving from the south!

|
|
About the same time as the foregoing expedition and unbeknown to its leaders until after the expedition, a paper by Christie et al. (1979) reported a study of intrusive-type flows and solitary waves in the lower atmosphere observed in microbarograph records at the Warramunga Seismic Station at Tennant Creek, about 600 km west-southwest of Burketown. In that paper, Christie et al. (1979, p. 4968) state that ". . . it seems very likely that the morning glory phenomenon is in fact a manifestation of a fairly well-developed large-amplitude isolated solitary wave or group of solitary waves. In this interpretation the roll clouds are associated with the closed circulation cells in the streamline pattern of large-amplitude deep-fluid internal solitary waves propagating along a marine inversion." The data gathered during the expedition broadly supported this view.
Structure and origin of the morning glory
Analysis of data from the 1979 expedition showed that the morning glory had the structure of an undular bore propagating on a stable layer of air in the lowest half to-one kilometre of the atmosphere (Clarke et al. 1981). The structure is analogous to that of undular bores that form on tidal rivers. The clouds are essentially wave-type clouds associated with the constituent bore waves (see Figure 4). As a wave crest approaches, air parcels rise and cool and condensation occurs leading to cloud. Then, as the wave crest passes, the air parcels descend and warm so that the cloud re-evaporates. Thus the clouds are not simply being carried along with the air flow: rather cloud is continuously being formed at the leading edge of each wave and continuously eroded at the trailing edge.
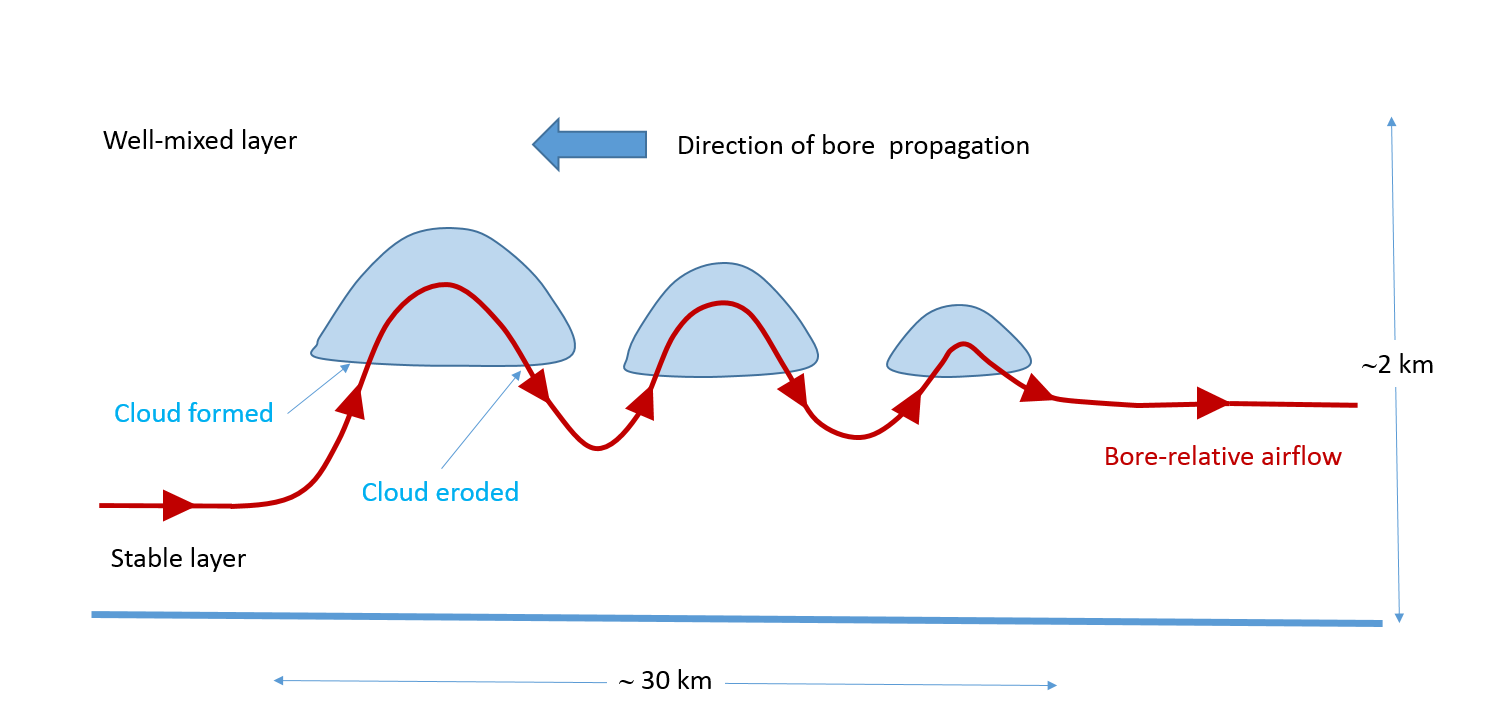
|
Wave propagation, itself, requires a so-called wave-guide. The data from the 1979 expedition showed that the wave guide for the morning glory is related to the particular thermal structure of the lower atmosphere in the southern region of the gulf, which consists of a deep well mixed (neutrally-stable) layer overlying a shallow stable layer. The neutral layer aloft is a result of the deep well-mixed layer formed over the land on the previous day and the stable layer is associated with cooler air that exists over the sea.
When the bore moves into drier air, as often happens as it moves inland after crossing the southern part of the Gulf, the clouds may dissipate while the bore waves remain. For this reason, Clarke et al. (1981) emphasize the squall-like nature of the disturbance rather than the cloud accompanying it, since disturbances unmarked by cloud are common over land. Some authors (e.g. Clarke 1983a,b, Smith and Morton 1984) have used the term "wind surge" to describe the overall disturbance. It may be noted that because of strong (dry) convective overturning, the low-level stable layer over the land rarely survives into mid-morning; however, there is evidence from surface microbarograph data that disturbances continue to propagate in some form for a considerable distance inland during the day (Christie et al. 1978; Christie, personal communication, 1985). The nature of the wave guide at this stage of the disturbance remains to be determined.
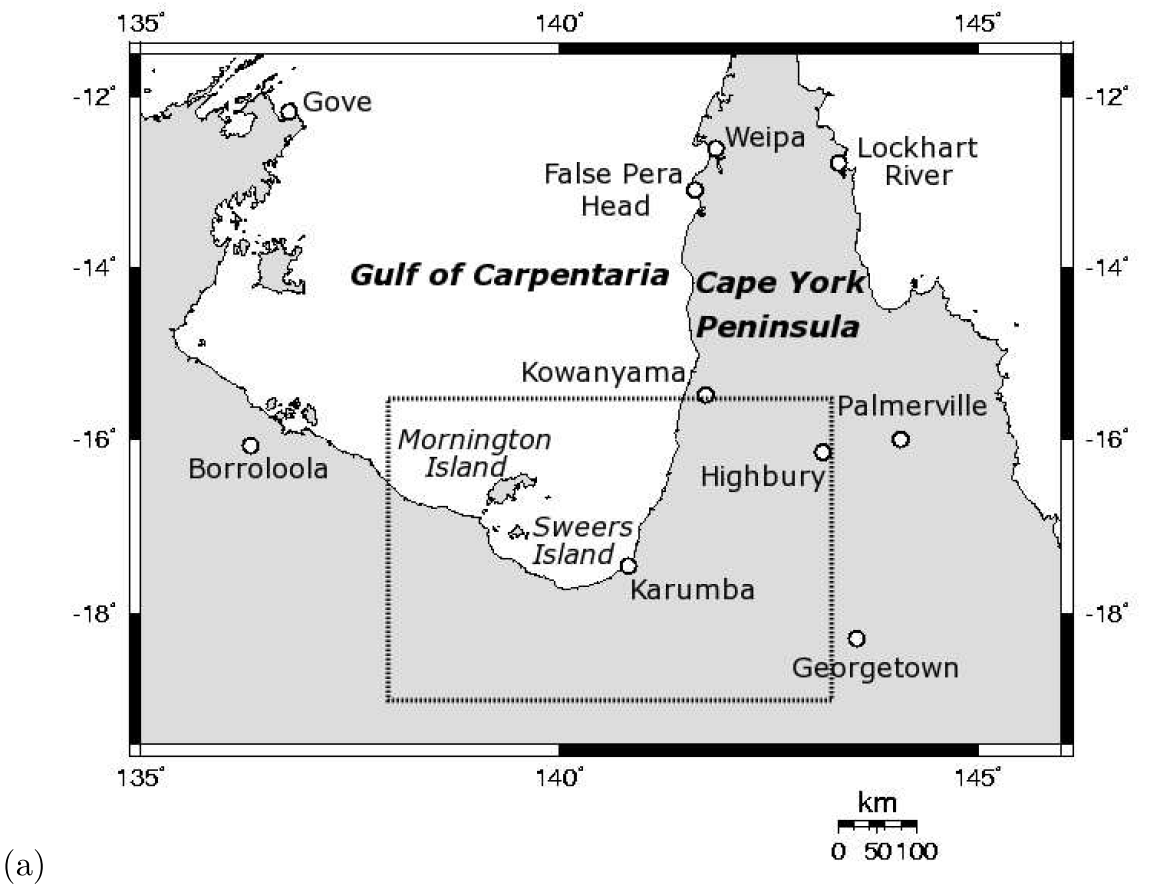
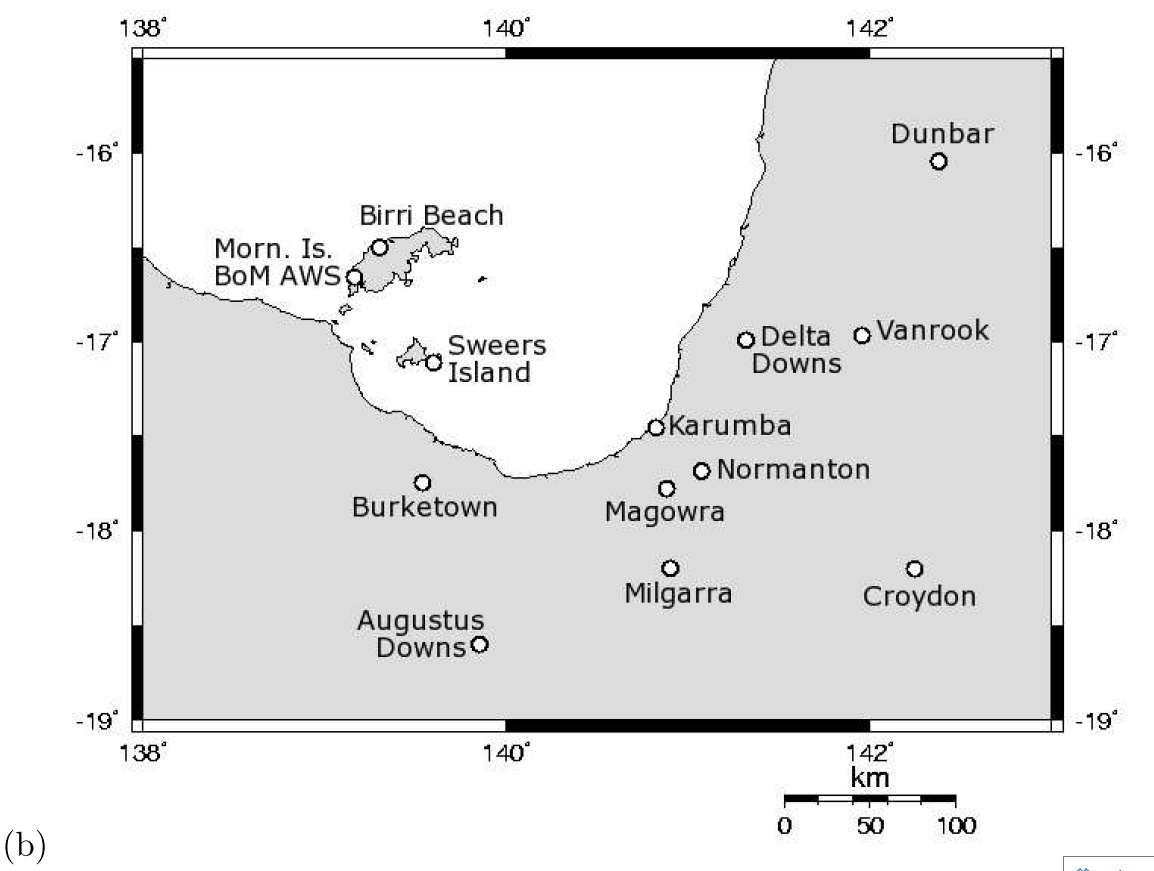
Northeasterly morning glories have been shown to originate during the late evening over the western side of Cape York Peninsula when; assisted by the prevailing wind, the east coast sea breeze crosses the peninsula and encounters the sea breeze from the west coast of the peninsula (Clarke et al. 1981, Clarke, 1983b). The collision of sea breezes can be illustrated in the laboratory. The origin of morning glories from the south is less well understood, but it has been shown that at least some are associated with cold front passages across the Australian continent (see below). It is known that these have the essential bore-like structure of their northeasterly counterparts (Smith et al. 1982). What is especially remarkable is that, with a few exceptions, they tend to occur at Burketown (see Fig. 5 for locations) at much the same time as northeasterly ones, typically between about 0500 and 0800 EST. (EST refers to eastern standard time = GMT+ 10 hours.)
|
|
Several more field experiments were organized in the decade following the 1979 expedition and many more disturbances were documented (Smith et al. 1982, Smith and Morton 1984, Smith and Page 1986, Smith et al. 1986). These disturbances included a few from the south, the origin of which, at first, was a complete mystery (see below). Some more recent field experiments are described below.
 (a) (a)
|
 (b) (b)
|
 (c) (c)
|
Favourable synoptic conditions
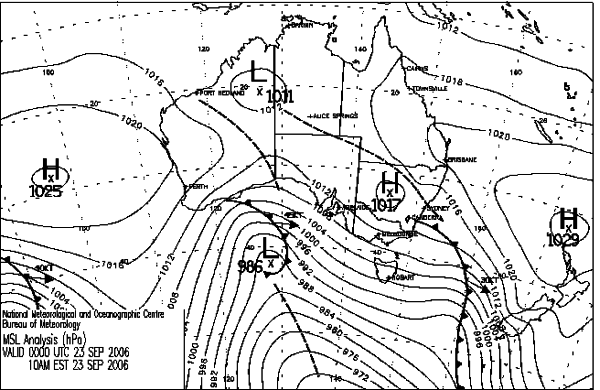
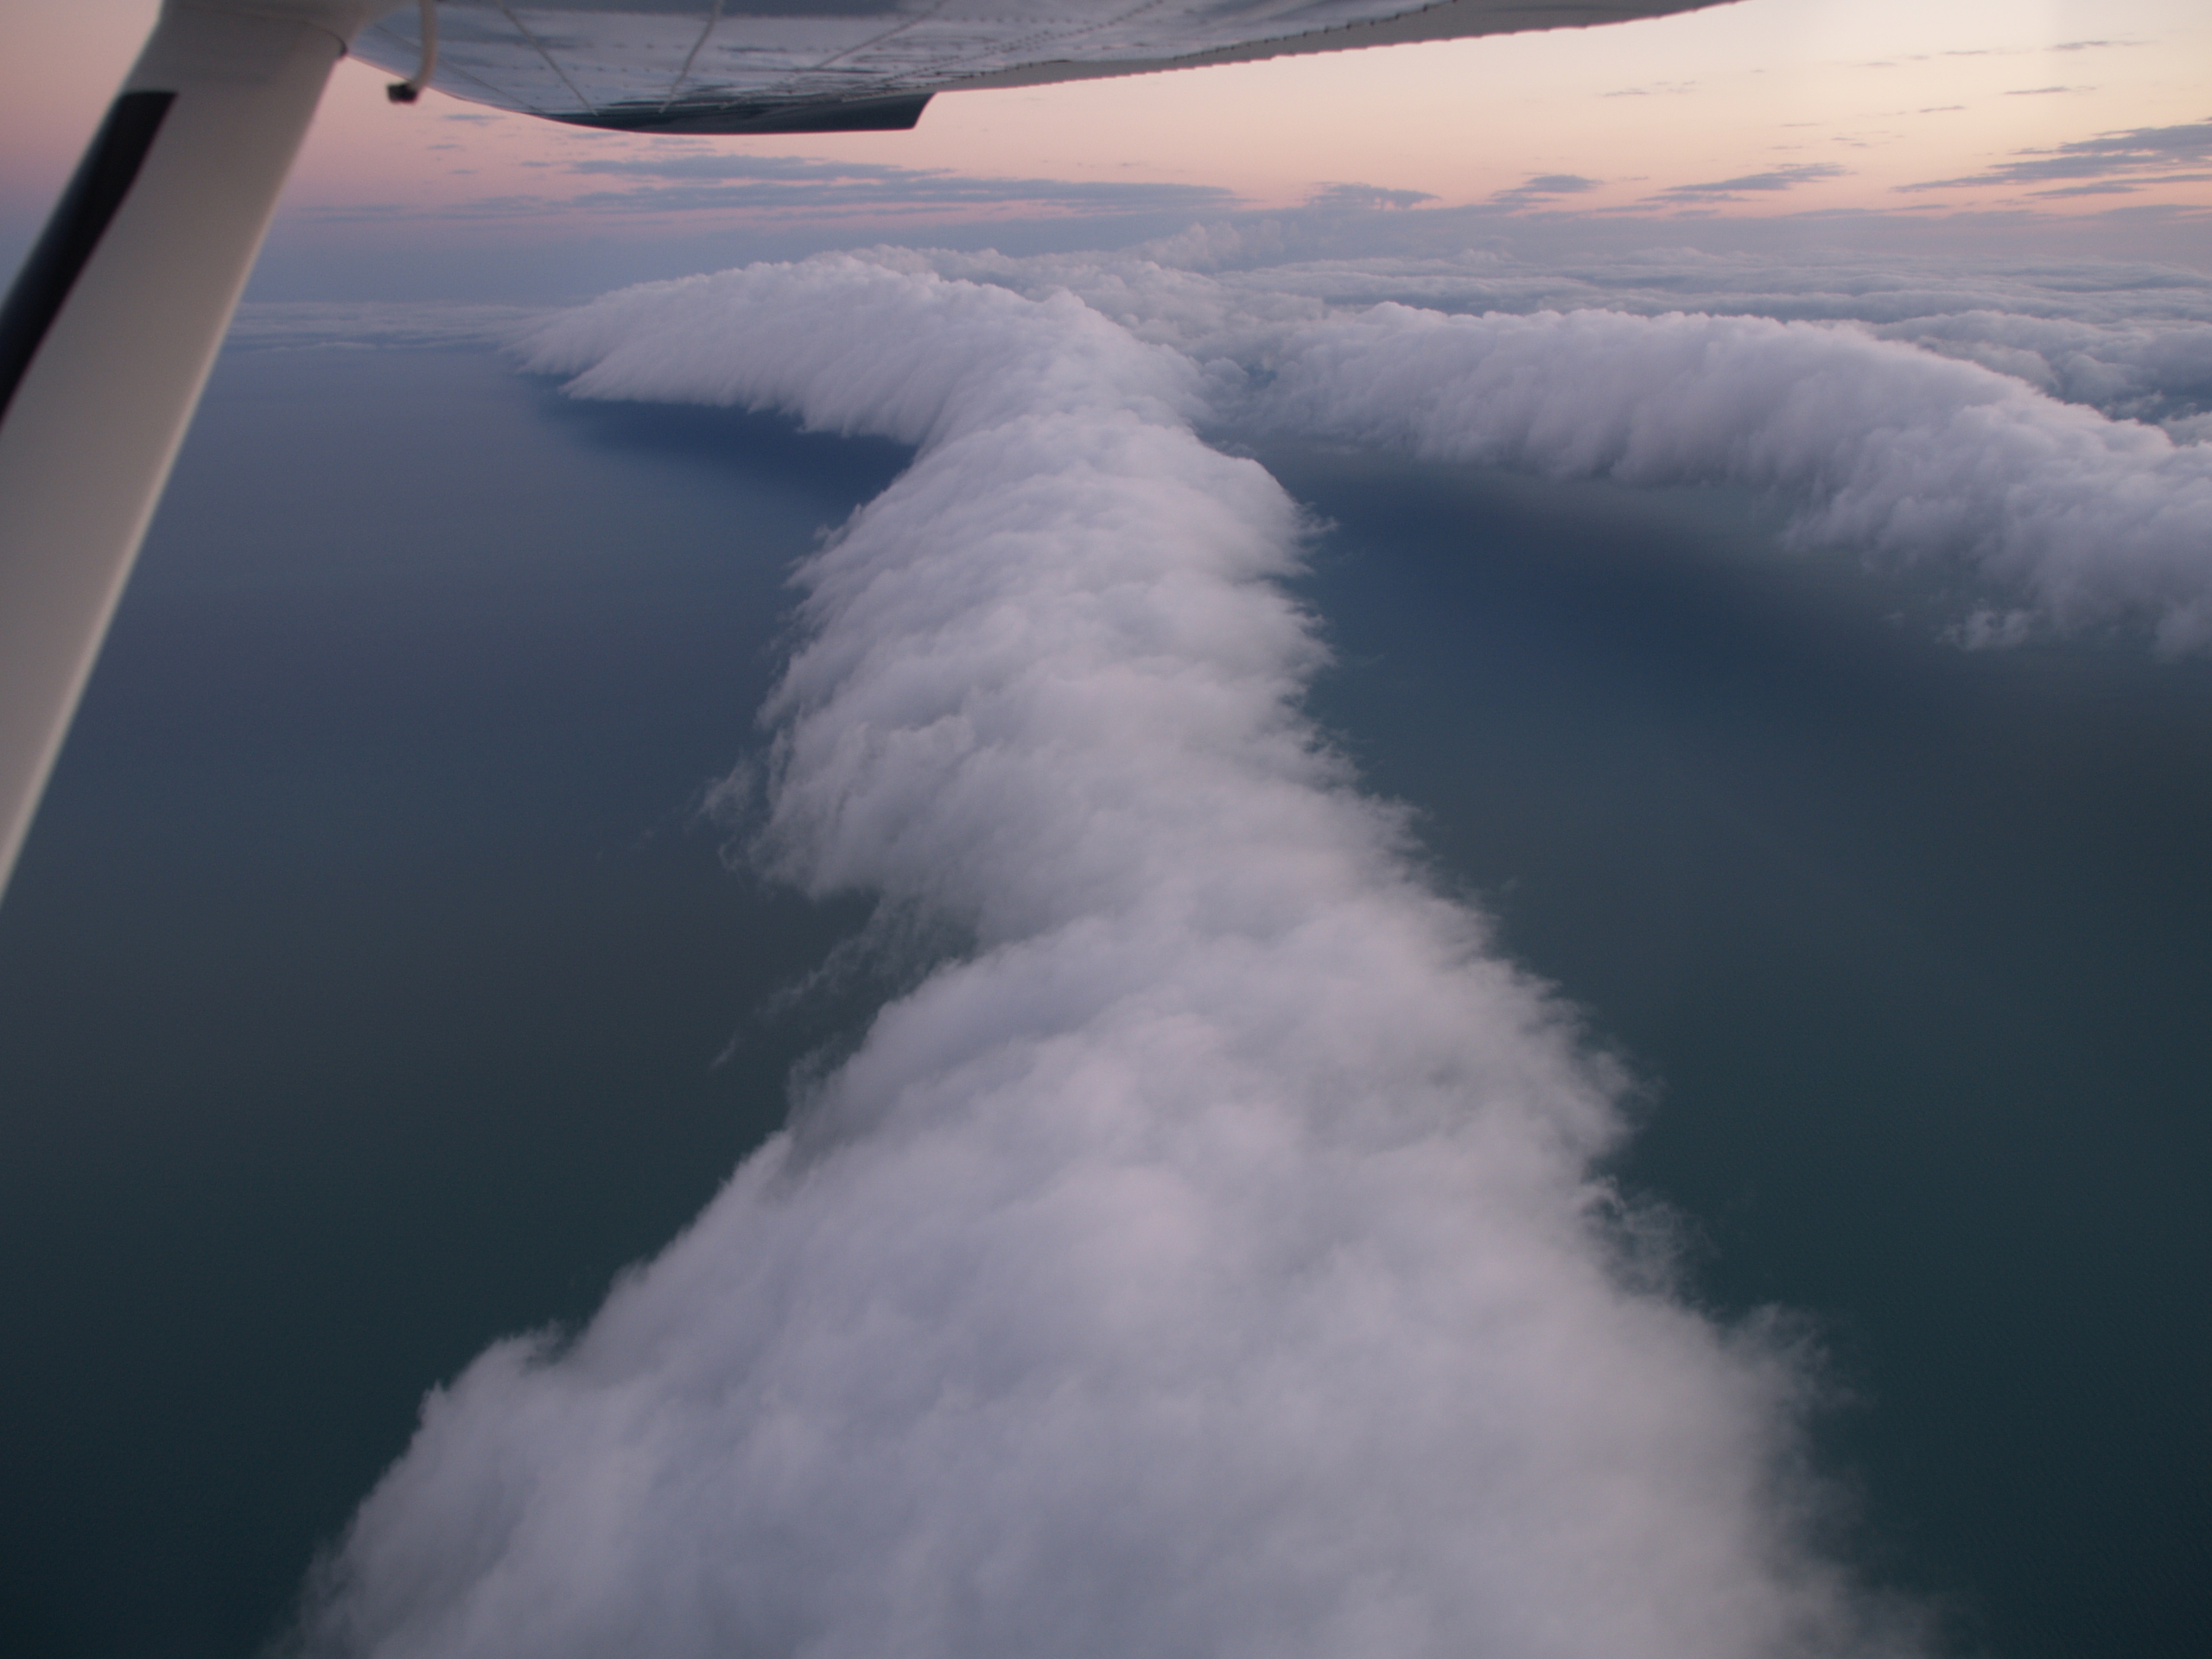
The occurence of northeasterly disturbances appears to be favoured by a synoptic-scale ridge of high pressure along the east coast of Queensland with associated northeasterly geostrophic winds over Cape York Peninsula. An example is illustrated by the mean sea level pressure analyses at 1000 EST on 24 Sep 2006 shown in Fig. 7. A morning glory was observed over the southern gulf early on the following morning. following morning (Fig. 8). Click here for a video of this event. The video is almost 250 Mb.
|
|

|
Numerical simulations
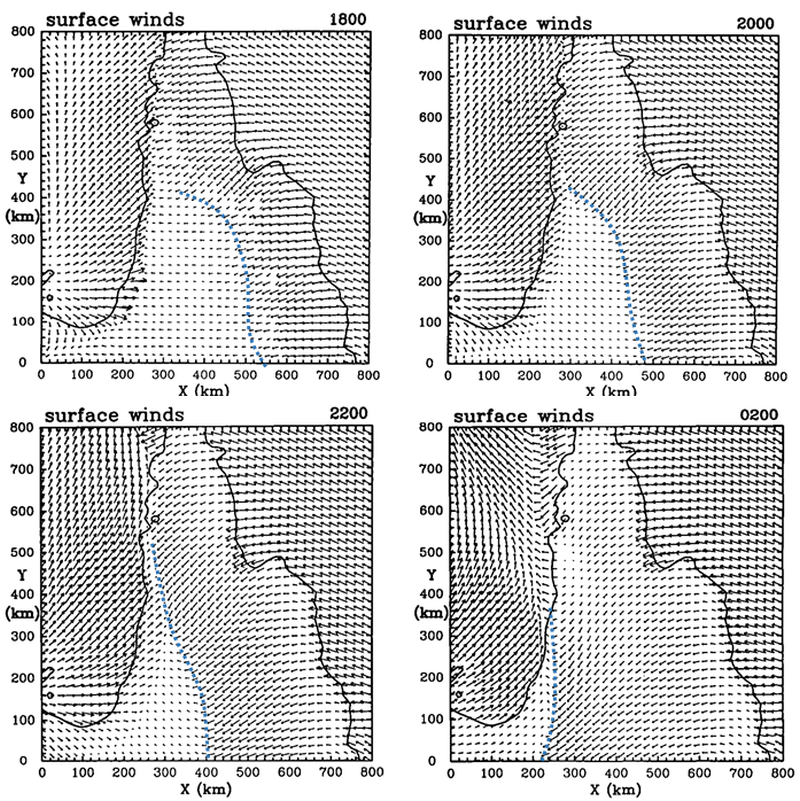
The data obtained from the field experiments motivated attempts to simulate the morning glory, or at least the sea-breeze circulations that were believed to lead to it, using numerical models. Two first attempts were those of Clarke (1984) and Noonan and Smith (1986), both using two-dimensional models for the flow in a vertical cross-section across Cape York peninsula. Shortly after, Noonan and Smith (1988) carried out a three-dimensional simulation over a domain that included the peninsula. The results supported the presumed role of sea-breeze circulations over Cape York Peninsula in the generation of the morning glory. The collision of the east- and west-coast sea-breezes under conditions of a moderate (5 m s-1) easterly synoptic flow typical in the dry season is manifest as a convergence line that extends progressively southwards with time along the entire length of the Peninsula near the west coast (see Fig. 9). Collision of the sea breezes occurs in the late afternoon or early evening in the north of the peninsula, where the peninsula is comparatively narrow and progressively later in the south, where the peninsula is much broader.
The rapid development of computer power in the 90's provided the possibility of repeating the foregoing calculations with higher spatial resolution and a over a larger domain. A set of such calculations was reported by Smith and Noonan (1998). While these calculations examined a range of additional features of the precursors to morning glory disturbances, they confirmed also the results of earlier ones concerning the role of sea breezes. for example, calculations for a range of horizontally-uniform geostrophic flows over the region, with directions typical of those that occur during the dry season, show that the development of westward-moving lines of low-level convergence over the gulf is the rule. This explains why travelling convective- and wave-cloud lines are commonly observed there. The convergence lines are associated with sea-breeze circulations that develop over Cape York Peninsula and around the gulf. For easterly and northeasterly geostrophic flows, the circulations that develop are broadly repeatable from day to day, despite the relatively long inertial period (nearly two days) in the region. However, this is not the case for a southeasterly flow.
Calculations with and without orography show that the orography on Cape York Peninsula enhances the low-level easterly flow over the eastern side of the peninsula, but delays the formation of the morning glory convergence line on the western side.
|
Goler and Reeder (2004) used a high-resolution cloud model is used to explore in detail the generation of the morning glory. The model is two-dimensional and nonhydrostatic and simulates an east-west cross section of the southern part of Cape York Peninsula with a horizontal grid spacing of 200 m. The calculations are initialized at sunrise with a 5 m s-1 easterly flow and a temperature and humidity sounding taken upstream from the peninsula. As in earlier studies, the sea breezes that develop over the peninsula are highly asymmetric with the east-coast sea breeze being both deeper and warmer than its western counterpart. When the sea breezes meet, the east-coast sea breeze rides over that from the west coast (as in the laboratory experiments described below) and in the process produces a series of waves that propagate on the west-coast sea breeze. The calculations show that when the phase speed of these waves matches the westward propagation speed of the east-coast sea breeze, the waves grow to large amplitude, thus forming the morning glory disturbance. When the east-coast sea breeze propagates too fast relative to the waves, the waves do not amplify. Goler and Reeder concluded that the morning glory is generated by a resonant coupling between the east-coast sea breeze and the disturbances that propagate on the shallow stable layer produced by the west-coast sea breeze. The number of waves produced was found to depend on the vertical stability of the west-coast sea breeze and the strength of the east-coast sea breeze.
As in the Smith and Noonan (1998) calculation, the inclusion of orography representative of Cape York Peninsula does not change the overall result with a morning glory forming in much the same way as in the case without orography. The main difference is that the sea breezes meet earlier when orography is included.
Southerly morning glories
The observation at Burketown of a morning glory moving from the south at the end of the 1979 field experiment was a total surprise, but a year later two similar disturbances were documented and it became apparent that such occurrences were not uncommon. A summary of the early southerly morning glories documented was presented by Smith et al. (1986). A feature of the synoptic mean sea level pressure patterns conducive to the formation of southerly disturbances over northern Australia was found to be the extension of a ridge of high pressure across the continent directing a southerly to southeasterly airstream over western Queensland. In some cases, strong ridging occurs during the 12- to 24-h period prior to the disturbance and is preceded by the movement of a frontal trough across central Queensland; in other cases, the ridge is quasi stationary and the front (at least as commonly analyzed) is absent. However, the inland heat trough is always a prominent feature along the leading edge of the ridge. It is well marked in model forecasts as a narrow line of enhanced low-level cyclonic vorticity and, from available observations, it appears to be coincident with the dryline. Figure 10 below shows the mean sea level pressure analyses leading up to two well-documented southerly morning glory events.
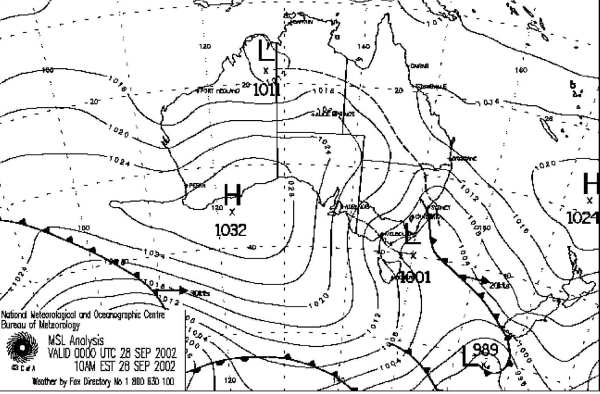
|
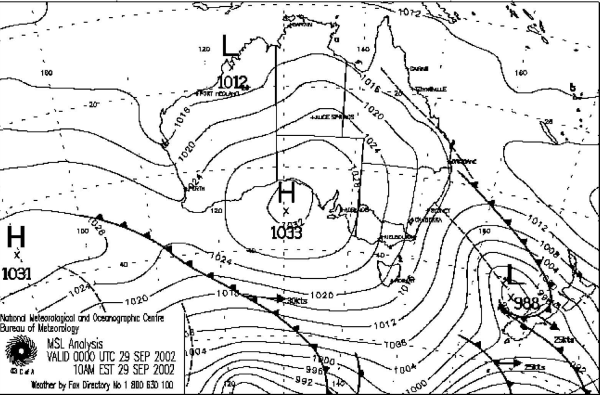
|
The analyses of available data for the events described by Smith et al. (1986) pointed to a possible connection with cold fronts crossing the continent to the south, at least in some cases, and also with the inland heat trough. However, at the time, little was known about the structure of fronts that penetrated far northwards across the dry continent. Solving this mystery called for an observational programme to acquire the necessary data. To this end, a pilot experiment was organized September 1988 to document one or two cases (Smith and Ridley 1990) and two subsequent experiments, more extensive in scope were carried out in early and mid-90's (click here for further information on these experiments and the accompanying research on subtropical continental cold fronts). During the first of these experiments in 1991, an unprecedented data set was obtained on a cold front that crossed the northern part of the continent and transformed over night into a southerly morning glory (Smith et al. 1995). The foregoing analyses stimulated also a program of research to examine the dynamics of heat lows and heat troughs (click here for a description and summary of the findings of these studies).
In September 2002, a major field experiment (the Gulf Lines EXperiment, GLEX) was organized by the Bureau of Meteorology, Monash University and the University of Munich to study another kind of cloud line that is common over the Gulf of Carpentaria, the so-called North Australian cloud line, or simply gulf line (Drosdowsky and Holland 1987, Drosdowsky et al. 1989, Goler et al. 2006). In the dry season, this is typically a line of congestus clouds that stretches across much of the gulf and moves westwards with time. However, during the "wet season" it is sometimes characterized by a line of heavy showers or thunderstorms. On two days during the GLEX experiment, particularly interesting southerly morning glory disturbances were documented and we discuss these briefly in the next two subsections. Further information may be found in Smith et al. (2006).
A special feature of this event was the clear double change structure at all automatic weather stations (AWSs) in the southeastern gulf region with an undular bore-like wave preceding and separating from an airmass change in the form of a dryline. As in other major events documented, it was accompanied by ridging over the northeastern part of the continent (Fig. 9). In this case, the ridging was strong enough to push the trough a considerable distance northwards over the gulf and the peninsula. As a result, there was a significant airmass change across much of the AWS network with dry continental air extending out over the gulf. At Karumba, there were strong southeasterly winds with blowing dust following the change.
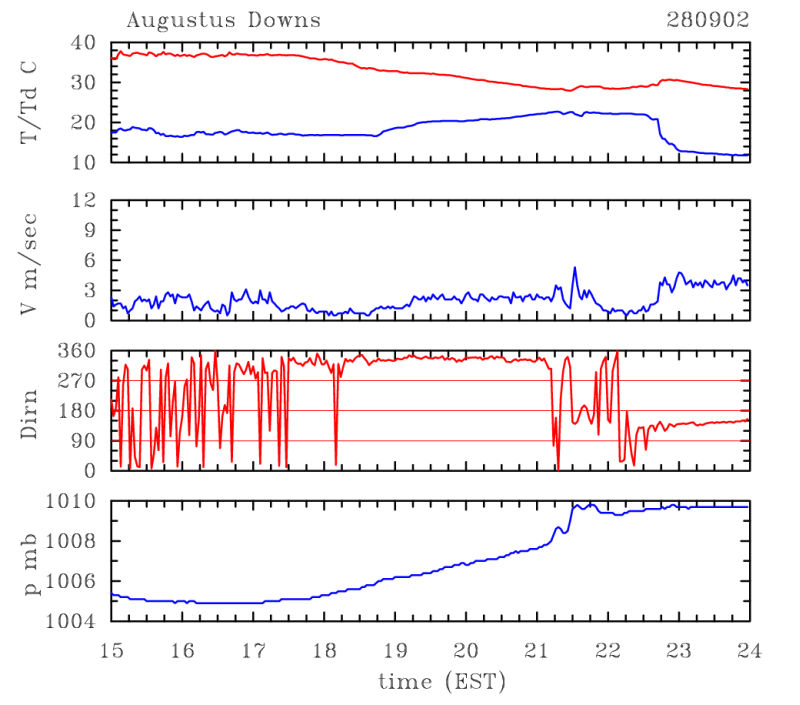
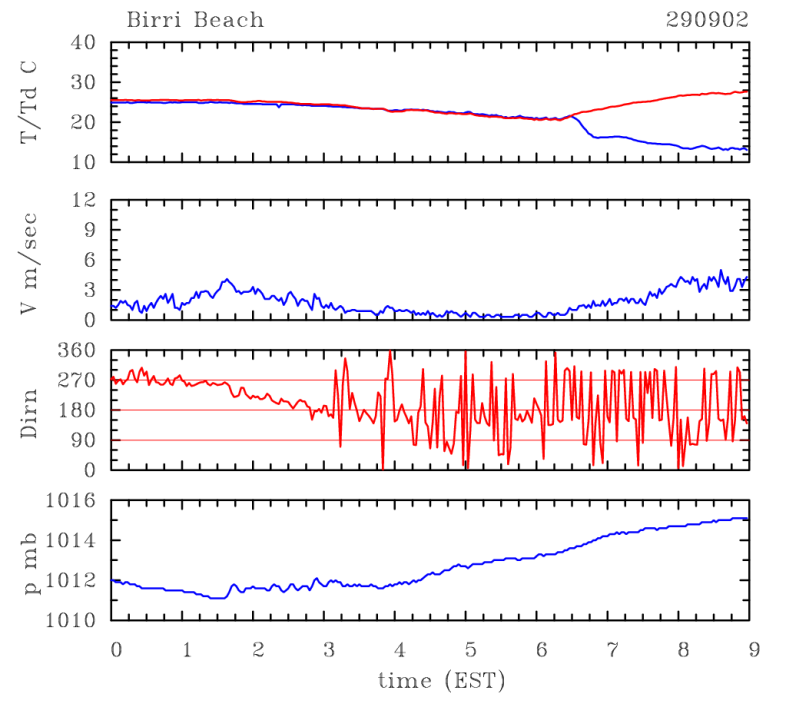
Figure 11 shows the time series of various quantities from two of the AWS stations: Augustus Downs (one of the southernmost stations) and Birri Beach on the northern side of Mornington Island in the gulf. At the southernmost station, Augustus Downs, the bore wave is evident as a sharp pressure jump at about 2115 EST, accompanied by a sharp increase in wind speed and an abrupt change in wind direction from one slightly west of north to a southerly. A second wave of the bore with a further jump in pressure occurred about 15 min later. The passage of the trough line (effectively a dryline) was marked by a sharp fall in the dewpoint at around 2300 EST, accompanied by a slight increase in temperature and a rapid freshening of the wind from the southeast. The surface data from Birri Beach show a similar structure, with the bore wave onset at about 0150 EST and the airmass change just after 0645 EST. Thus, the bore wave had separated farther from the airmass change as the disturbance moved northward.
There was not much of a temperature change recorded at the surface with the passage of the bore wave, although mesoscale analyses of the
event do indicate a relatively deep layer of cooler air following the change. This is not necessarily inconsistent with the surface observations. In fact,
these often show a rise in surface temperature accompanying the passage of a
|
|
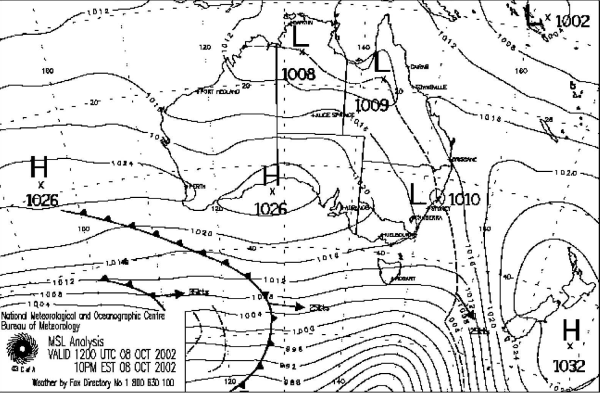
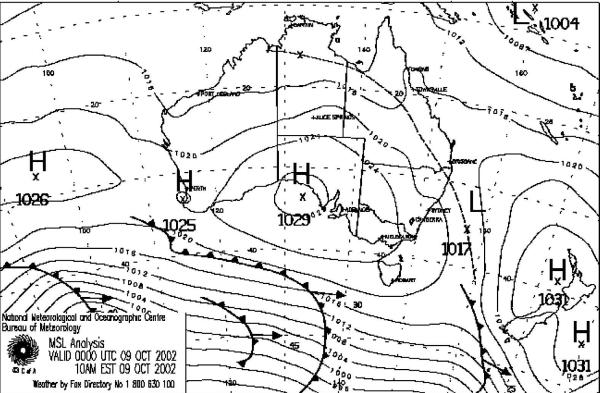
On this day, three morning glories were observed, one moving from the southeast, one from the south and the other from the north east. These disturbances were documented in unprecedented detail with airborne measurements as well as surface observations. The synoptic situation was very similar to that for the previous disturbance, namely a ridge of high pressure moving across the continent and the inland trough line on its northeastern side moving northeastwards towards the gulf (see Fig. 12). Recognition of this favourable pattern, which emerged from the earlier studies of Smith et al. (1982, 1986), enabled us to forecast the event 8 days ahead on the basis of the Bureau of Meteorology's global numerical prediction system. With this amount of lead time we were able to deploy the instrumented research aircraft available to the experiment.
|
|
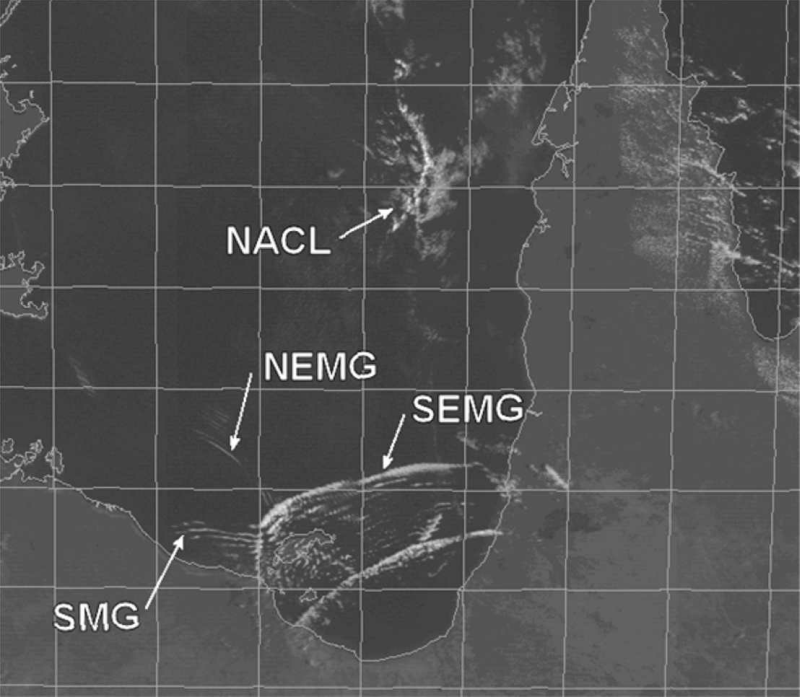
Sometime overnight on 8 October, southerly, southeasterly, and northeasterly morning glory disturbances developed. The most prominent feature in the Geostationary Meteorological Satellite (GMS) visible image at 0832 EST 9 October is the series of cloud lines in the southeastern corner of the gulf (Fig. 13). The family of cloud lines oriented northeast-southwest is the southeasterly morning glory. There is a cloud line also oriented northwest-southeast, marking the northeasterly morning glory, and a group of cloud lines essentially oriented east-west marking the southerly morning glory. The wave crests of each family are noticeably curved in the region in which they intersect. A weak NACL is visible also in the northeastern part of the gulf.
|
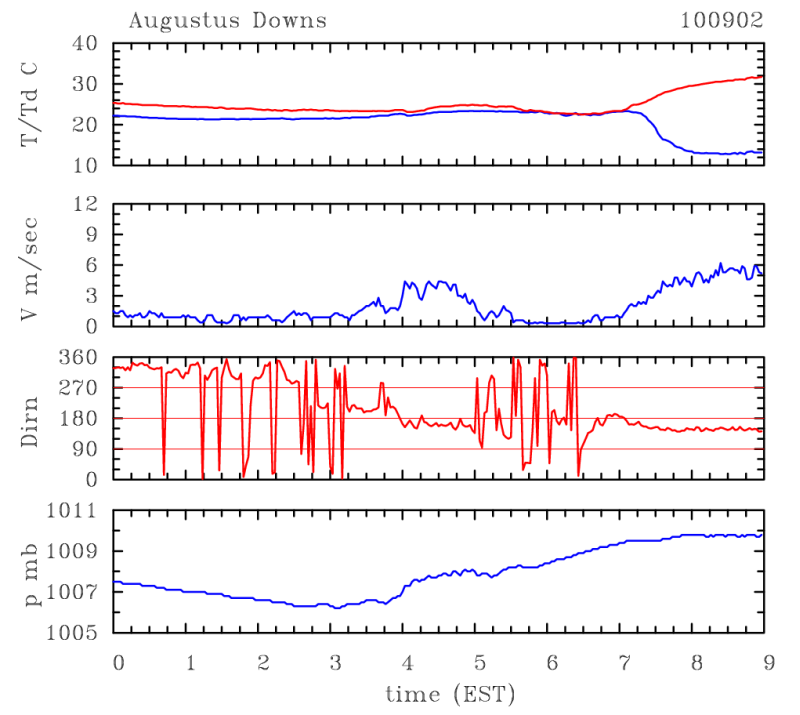
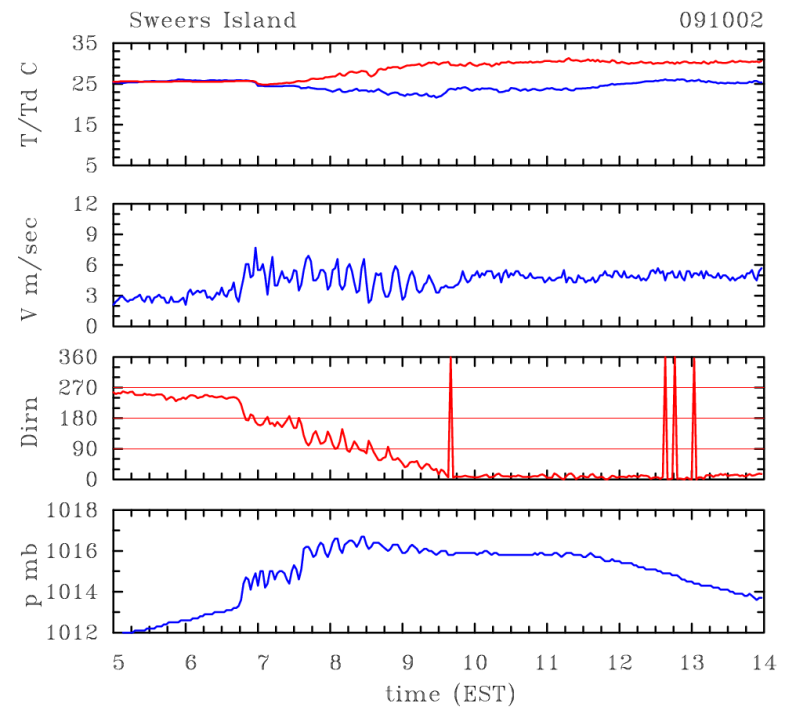
The AWS trace at Augustus Downs (Fig. 14) shows the passage of a single southerly disturbance at 0400 EST marked by a sharp rise in the pressure, a slight decrease in the temperature and dewpoint temperature, and an increase in the wind speed. Ahead of the disturbance the wind was southwesterly but, as the disturbance approached, the wind backed to become southerly. Our data were inadequate to determine whether this disturbance was the southerly or southeasterly disturbance. The trace shows also the passage of the trough and dryline, which arrive at 0715 EST and are marked by a pronounced decrease in dewpoint temperature, an increase in wind speed, and the onset of a strong southsoutheasterly flow.
|
|
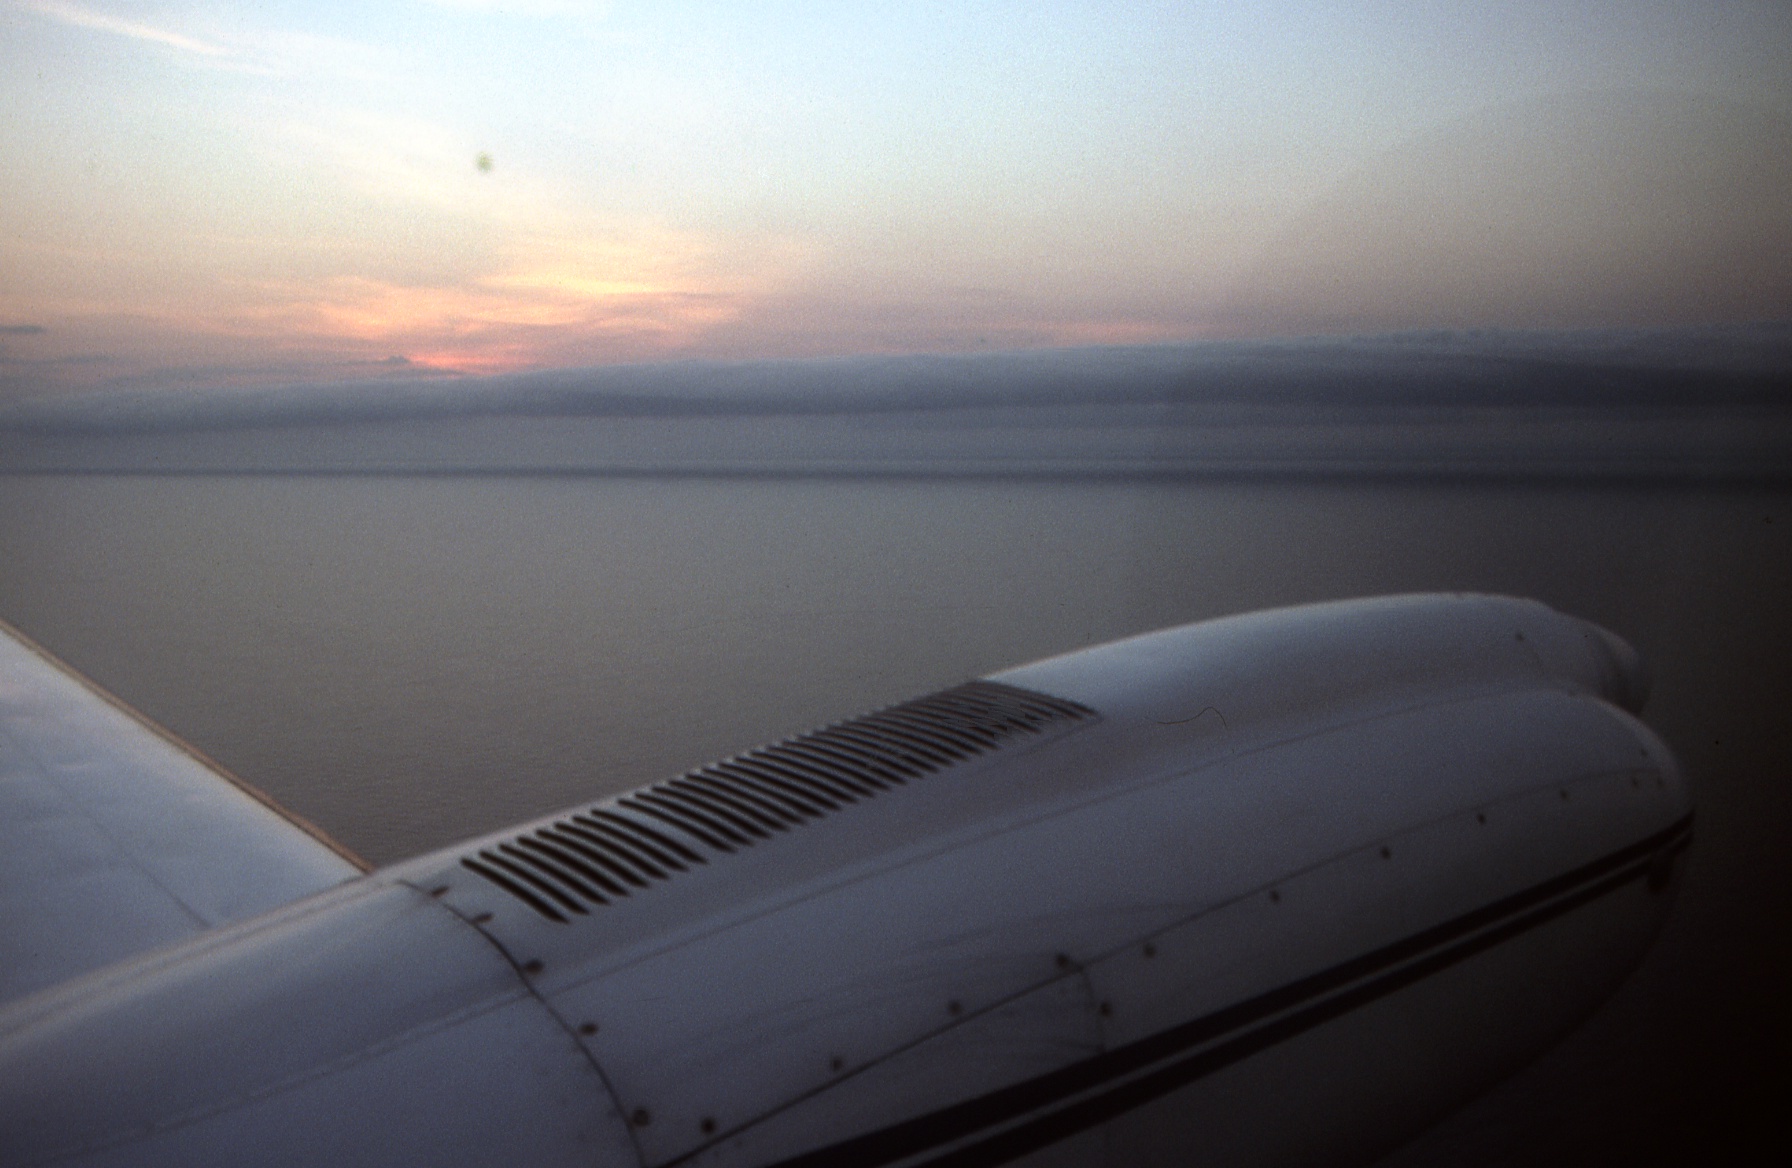
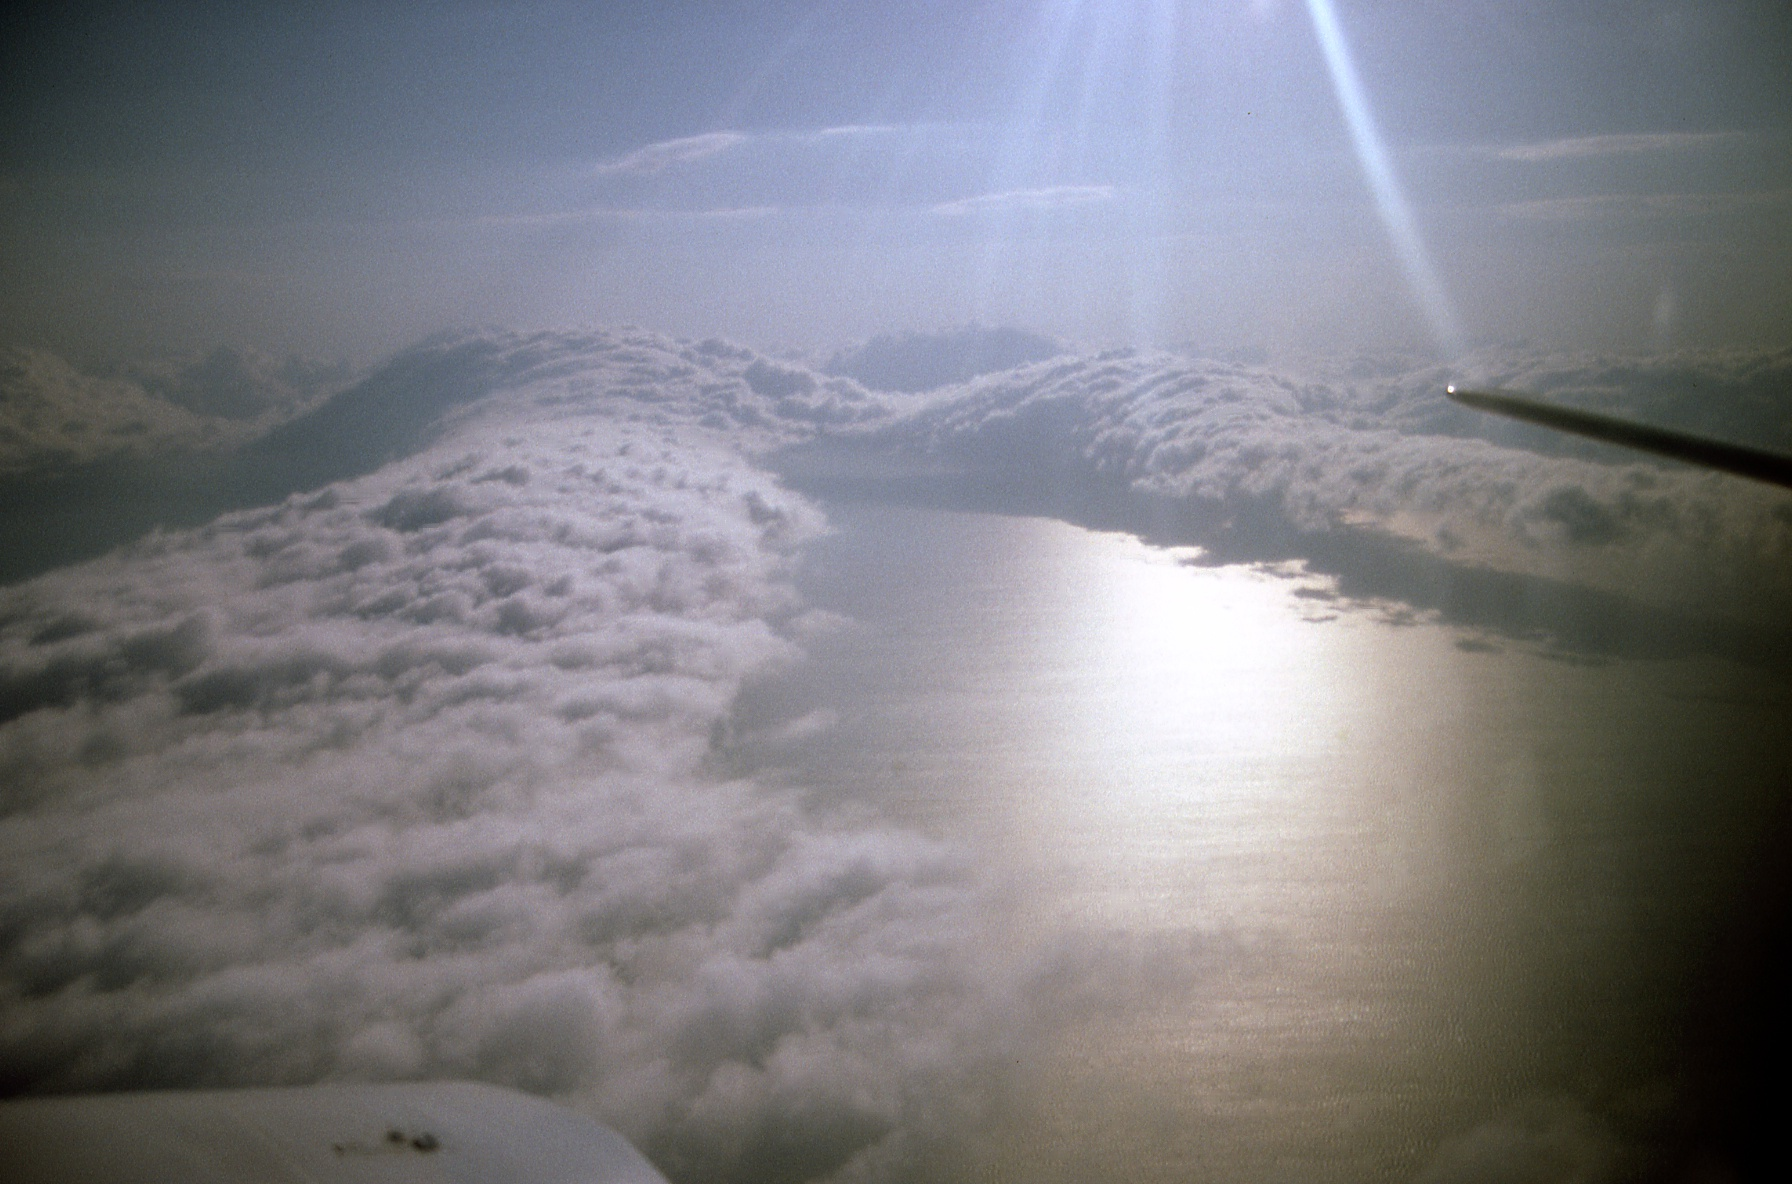
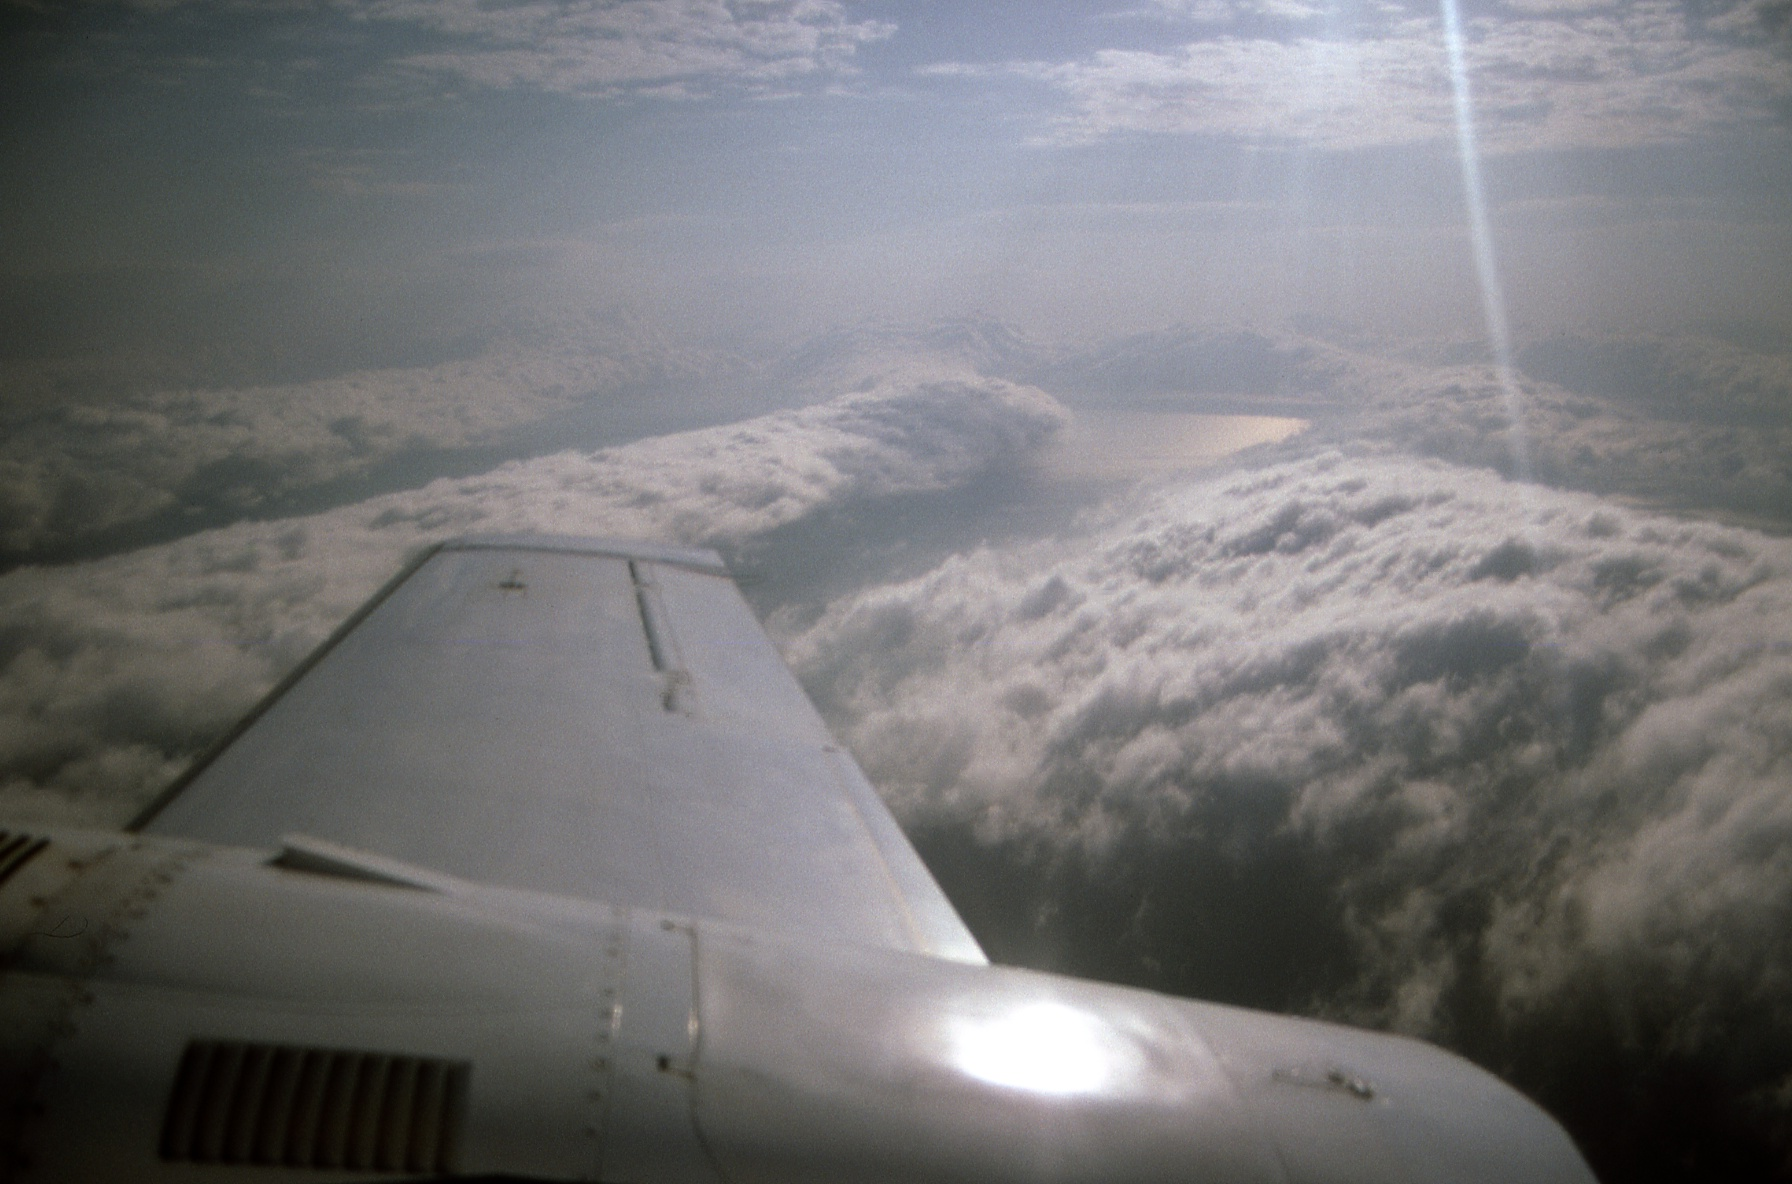
Figure 15 shows some aerial photos of the event and one of the aircraft. Refer to the paper for a summary of the aircraft observations.
 (a) (a)
|
 (b) (b)
|
 (c) (c)
|
Figure 16 shows a conceptual model a possible mechanism for the formation of southerly morning glories south of the gulf.
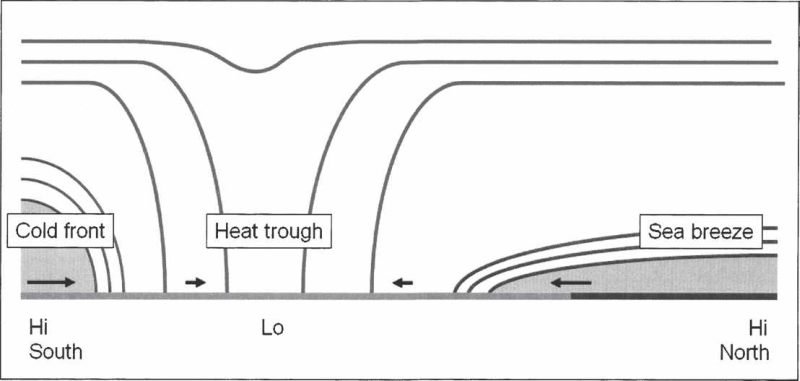
|
Interacting morning glories
A feature of the synoptic situation favourable for southerly morning glories (e.g. Figs. 10 and 12) is that it tends to be favourable also
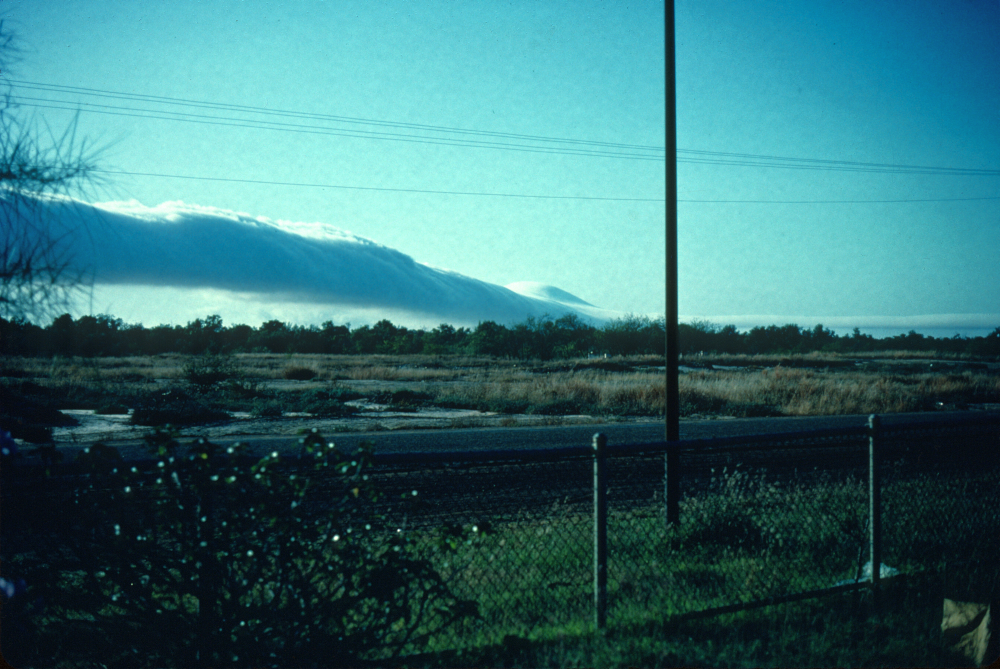
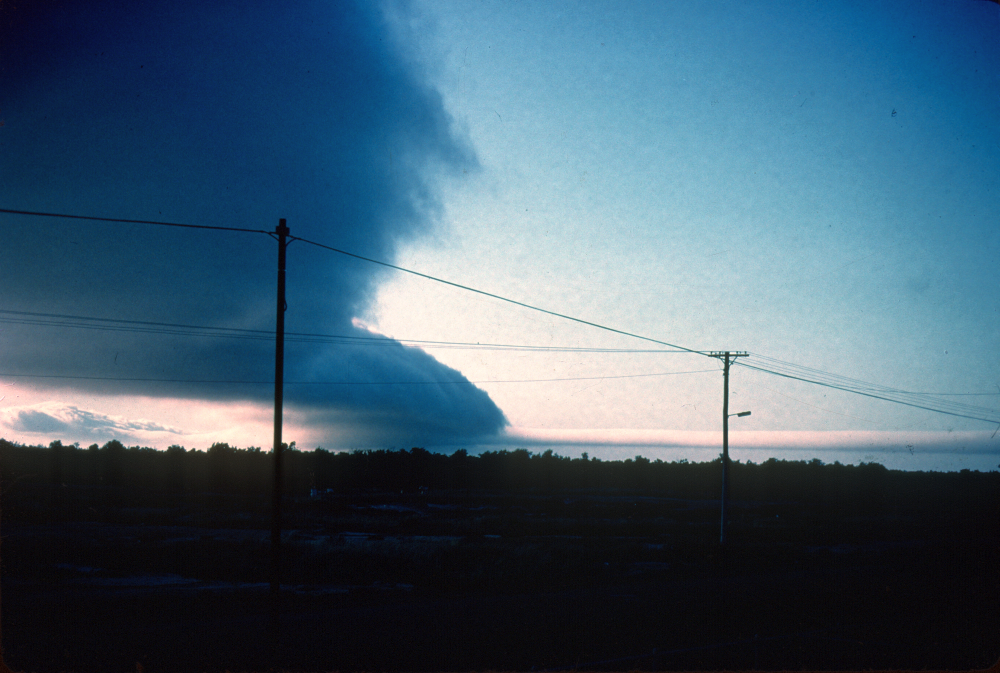
for the generation of northeasterly morning glories as well (see Fig. 7). Figure 17 shows rare early photographs of a norteasterly and southerly
morning glory meeting each other near Burketown (the photograph was taken by a teacher at the Burketown school).
The North Australian Cloud Line
The Gulf of Carpentaria region is frequented not only by morning glory wave clouds, but also be a range of convective cloud lines often
referred to generically as North Australian Cloud Lines (NACLs). Such lines form along the west coast of Cape York Peninsula early in the evening
and move westward across the Gulf of Carpentaria during the night and following day. Like the morning glory, they originate as a result of the
collision between the two sea breezes from the east and west coasts of the peninsula, which for a typical broadscale easterly flow occurs near
the west coast of the peninsula in the late afternoon (see e.g. Goler et al. 2006, Reeder et al. 2013). During the dry season the cloud lines are
mostly composed of shallow cumulus or cumulus congestus clouds, whose vertical development is hindered by the trade wind inversion at
about 3 km. However, during the moist season the cloud lines may develop as lines of thunderstorms that pose a significant forecasting problem
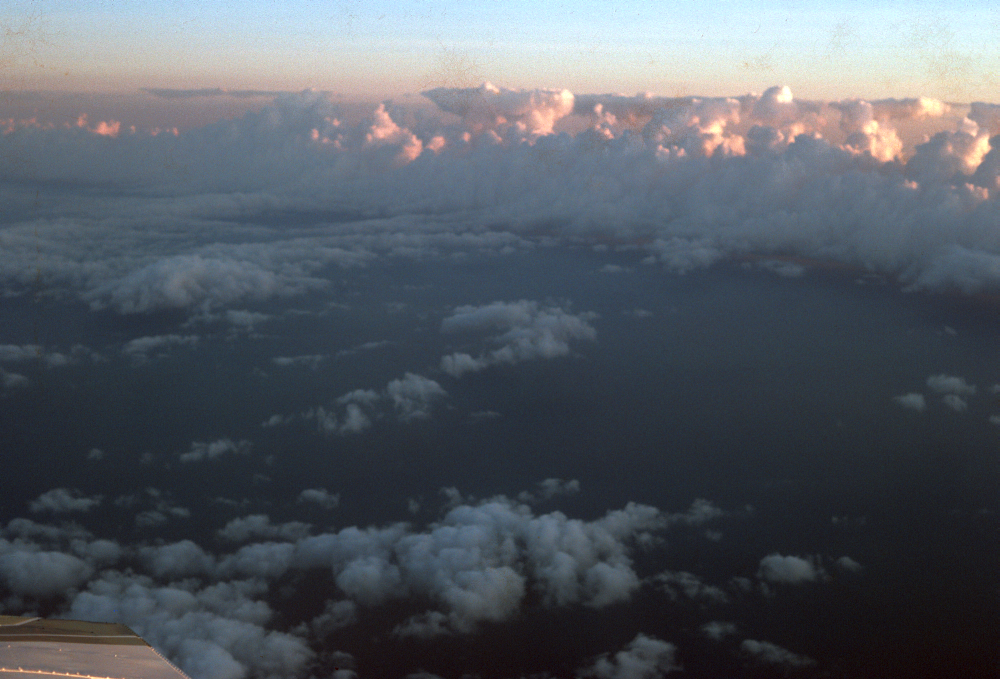
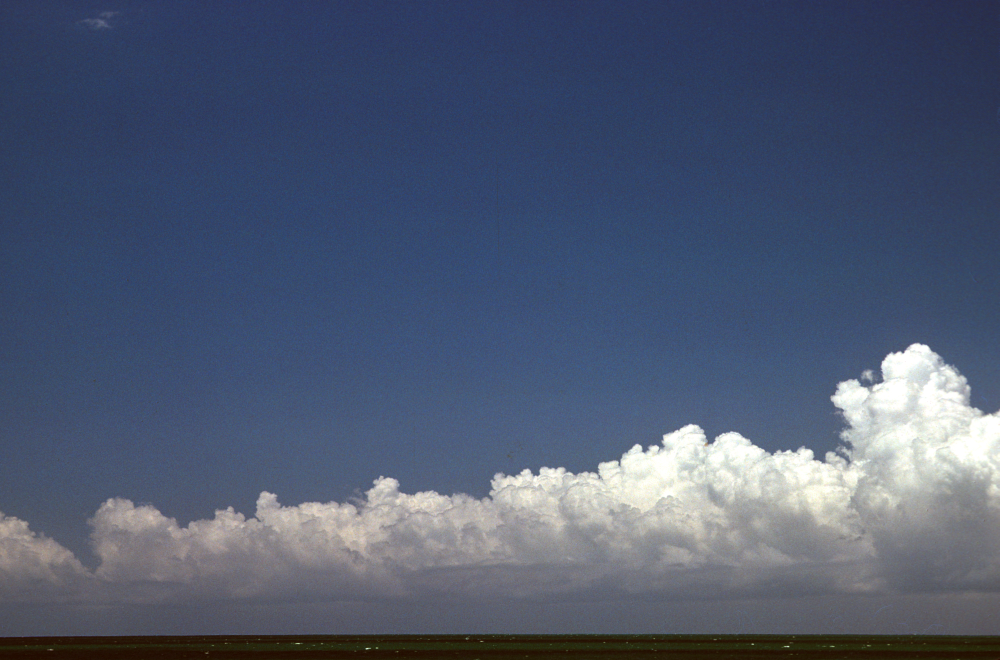
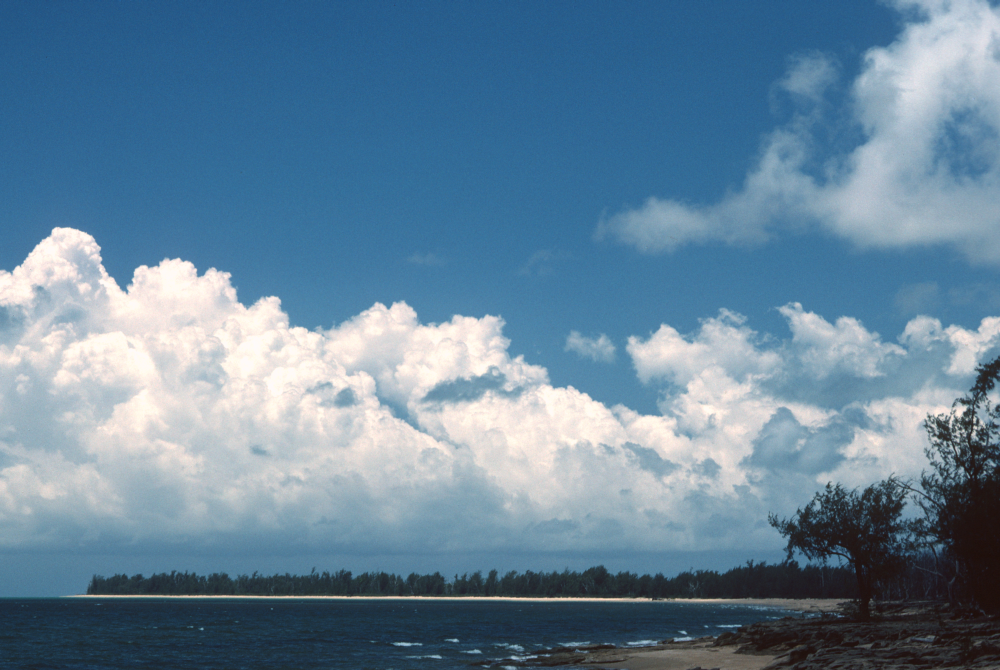
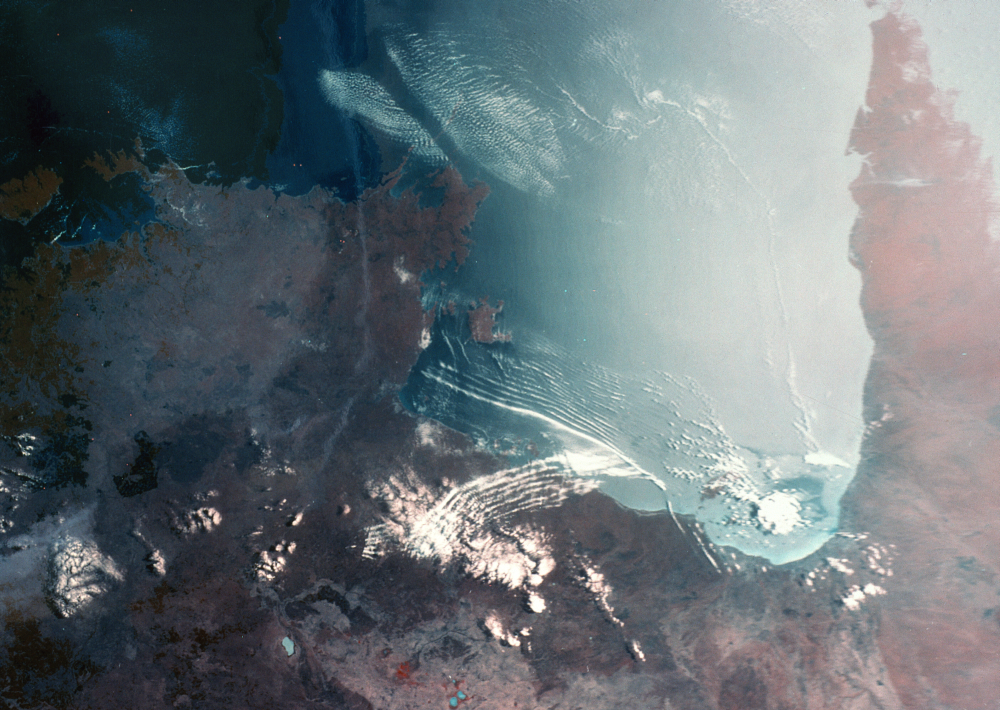
in the region (Drosdowsky and Holland, 1987, Drosdowsky et al. 1989, Goler et al. 2006). Examples of dry-season cases are shown in Fig. 18
while Fig. 18 is a satellite image indicating the richness of cloud lines that can occur simultaneously over the gulf.
 (a)
(a)
 (b)
(b)
 (c)
(c)
Following GLEX, two further experiments were organized to study cloud lines over the Gulf of Carpentaria region: GLEX II in 2005 and GLEX III in 2006. GLEX II was carried out in December to investigate the initiation of the NACL, which was accomplished using a small autonomous aircraft and two Doppler sodars. GLEX III focused on morning glories, which as discussed above are (mostly) southwestward-moving bore-like convergence lines that originate over the southern part of the gulf region. This experiment involved Doppler sodar measurements as well as high-temporal-resolution data from operational automatic weather stations. The findings of these experiments were reported by Reeder et al. (2013)
In brief, the observations show that the degree of asymmetry between west-coast and east-coast sea breezes (as characterized by the wind field) depends on the strength of the background easterlies, and that NACLs develop only when the background easterlies are sufficiently large (>5 m s-1). The sodar measurements showed that undular bore-like morning glory cloud lines develop only when the background easterlies are sufficiently weak (< 10 m s-1) and that strong bore-like morning glories develop when the background winds exceed about 10 m s-1. If the background easterlies are too strong, no morning glories develop.
Numerical simulations reported in Reeder et al. show that the structure of convergence line produced depends on the strength of the collision between the sea breezes from each side of the Cape York Peninsula, which in turn depends on the strength of the background easterlies. When the easterlies are weak (< 10 m s-1), the sea breezes have similar depths and strengths, and their collision is relatively violent, whereas when the background easterlies are strong (> 10 m s-1) the sea breezes have very different depths and strengths and their collision is comparatively benign.
Thomsen and Smith (2006) describe high-resolution numerical model simulations of low-level convergence lines that were documented during the GLEX experiment. The calculations provided further insights into the dynamics of the convergence lines and the mechanisms involved in their formation. In particular they show two clearly distinct convergence lines, one that corresponds to the morning glory and the one which corresponds to the North Australian Cloud Line. The former originates from the east-coast sea breeze over Cape York Peninsula south of about 14.S, while the latter originates from the east-coast sea breeze north of this latitude. The calculations support also the conceptual model for the generation of southerly morning glories shown in Fig. 16. In particular, they showed the separation of a bore-like disturbance following the collision of a nocturnal cold front to the south of the inland trough with a sea-breeze front to the north of the trough. Moreover, they show the progressive transition of the east-coast sea-breeze front and the inland cold front from gravity-current-like flows to bore-like disturbances overnight to form north-easterly and southerly morning glories, respectively.
Calculations by Thomsen and Smith (2008) showed the importance of the boundary layer parameterization in the numerical prediction of low-level convergence lines during the GLEX experiment. Calculations using five different parameterizations were compared with the observations to determine the optimum scheme for capturing these lines. The schemes that give the best agreement with the observations are the three that include a representation of countergradient fluxes and a surface layer scheme based on Monin-Obukhov theory. One of these, the Medium-Range Forecast scheme, is slightly better than the other two, based on its ability to predict the surface pressure distribution. The findings are important for the design of mesoscale forecasting systems for the arid regions of Australia and elsewhere.
Forecasting possibilities
Following a preliminary study by Jackson et al. (2002), Weinzierl et al. (2007) examined the possibility of predicting low-level convergence lines over northeastern Australia such as those which give rise to the morning glory. They used a mesoscale version of the Australian Bureau of Meteorology`s operational Limited Area Prediction System (MesoLAPS) and examined also aspects of the dynamics of such cloud line disturbances. The predictions were made during the Gulf Lines Experiment in 2002 and were compared with data collected during the experiment. An analysis of the entire 44-day period between 11 September and 24 October showed that with appropriate interpretation, MesoLAPS has significant skill in forecasting the lines, but it does not capture all of them. About 85% of forecasts of northeasterly morning glories and southerly morning glories, or of their nonoccurrence, were correct, while the corresponding percentage for the NACL was about 65%. However, about 15% of northeasterly morning glories and about 35% of NACL events that occurred were not forecast by the model. Only 6 out of 11 southerly morning glories were forecast.
The predicted orientation of the morning glory cloud lines were acceptable with a standard deviation error of 6o. In about 50% of the cases, the times of passage were within an hour of those observed and there was a marked tendency for the predicted lines to be late. MesoLAPS usually shows light winds at low levels ahead of the convergence lines with a sharp increase in wind speed behind the lines as is observed.
In the case of the two southerly morning glory disturbances discussed above, the model was able to capture the separation of a bore-like disturbance from the airmass change, although the model does not have the resolution to capture the wave-like structures that develop at the leading edge of the bore waves. A detailed analysis of the MesoLAPS calculations indicates that the broad-scale generation mechanisms of northeasterly and southerly morning glories are similar and it enabled the construction of a conceptual model for the generation of southerly morning glories shown in Fig. 16.
Climatology of disturbances
Nudelman et al (2010) presented a climatology of nocturnal or late morning pressure jumps at stations around the Gulf of Carpentaria and at one inland station south of the Top End. The climatology is based on one-minute average data from Bureau of Meteorology automatic weather stations. Of the 21 bore-like disturbances that were recorded at three or more stations during the four-month period August- November 2006, 16 were from the northeast sector and five had a significant southerly component. One of the latter was recorded as far west as Daly Waters. Only one northeasterly disturbance was identified at Groote Eylandt in the northwest of the Gulf.
Their study highlights the value of one-minute data in identifying the passage of all types of low-level disturbances at surface stations.
Such passages would be missed with the conventional hourly or even three-hourly data routinely available to forecasters. It was found that
a pressure jump criterion of about 0.25 hPa in three minutes is suitable for detecting the majority of morning-glory-type disturbances. Since
this study was initiated, considerably more data have become available and will provide a rich source of material to extend this climatology.
Theoretical aspects
Theories about the morning glory have focussed on the individual waves, that may be thought of as internal solitary waves, and on the way that such wavetrains evolve from particular typoes of initial disturbance (e.g. Christie et al. 1978, 1979). An excellent review is provided by Christie (1992). Some studies have focussed on the structure of the wave guide and the degree to which the wave energy is trapped in the lower troposphere, rather than leaking away to the upper atmosphere through vertically-propagating internal gravity waves induced by the disturbance (see e.g. (Menhofer et al. 1997, Smith and Noonan 1998).
Laboratory experiments with colliding gravity currents
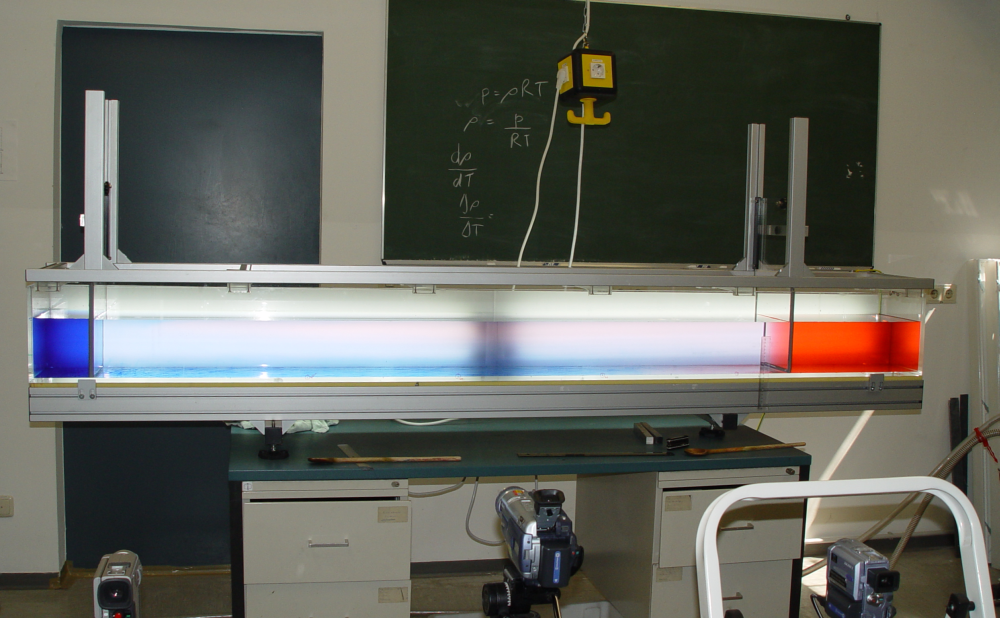
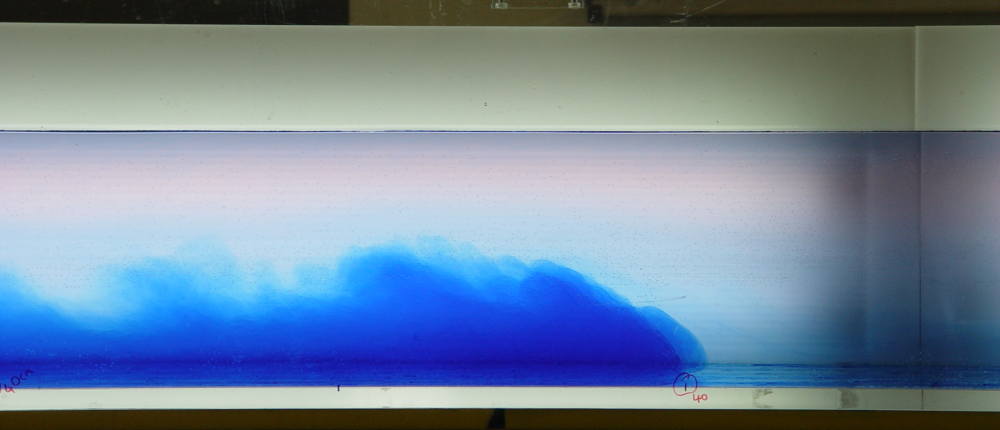
The collision of two sea breezes can be illustrated in a relatively simple laboratory experiment. The apparatus consists of a 2.5 m long plexiglass tank filled with water (Fig. 20). At each end of the tank are regions which can be isolated by two vertical plates. Salt and coloured dye are added in these regions to increase the density of the water by different amounts. The region on the left (coloured blue) has more salt added than the region on the right (coloured red) and is therefore heavier than the red coloured water.
|
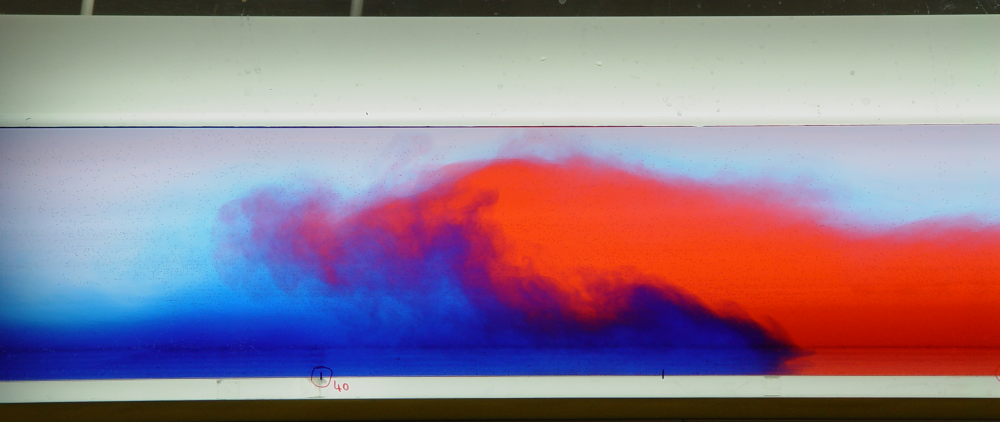
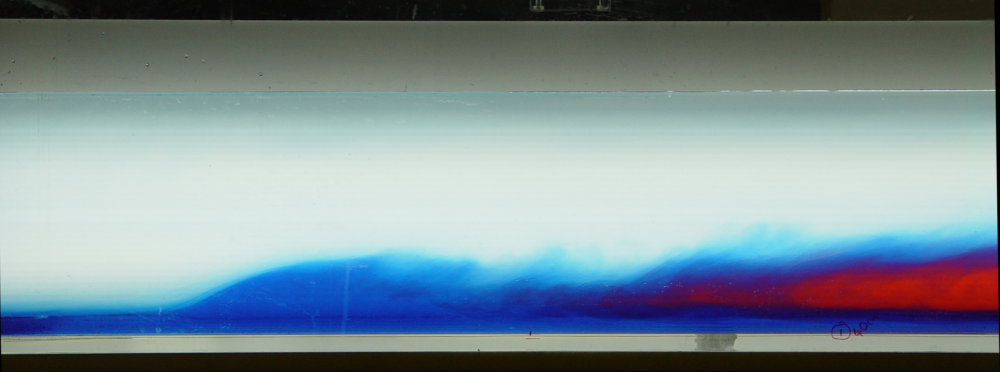
At the start of the experiment, both retaining plates are removed and the heavier water on the left and right flows towards the lighter uncoloured water as gravity currents, the blue-coloured water flows to the right (Fig. 21a) and the red coloured water to the left (Fig. 21b). Ultimately the two gravity currents collide and the lighter of the two coloured red ascends above the heavier blue-coloured current (Fig. 21c). Following the collision, a wave is generated on the heavier (blue) water and this wave runs ahead of the red water to the left. It is followed by an "intrusion" of the red water as a sort of tongue between the blue and uncoloured water. The point at which the two gravity currents collide is chaotic and very turbulent. One may think of the blue coloured water as the west-coast sea breeze over Cape York Peninsula, the red coloured water as the warmer east coast sea breeze, and the wave moving to the left on the blue water as the morning glory disturbance.
 (a) (a)
 (c) (c)
|
 (b) (b)
 (c) (c)
|
Click here for a video of this experiment. The video is 61 Mb. Related numerical experiments in which gravity currents move into stable layers as at the stage of evolution shown in Fig. 21c are reported by Hasse and Smith (1989a,b). These calculations indicated an alternative pathway to the collision of two gravity currents for the generation of wave-like disturbances. Simply, a single gravity current moving into a low-level stable layer can acquire wave-like properties that depend, inter alia, on the speed of advance of the gravity current compared with the propagation speed of waves on the stable-layer itself. This mechanism may be operative in the far south of the peninsula and in the generation of undular bore like disturbances by cold fronts.
Similar phenomena elsewhere
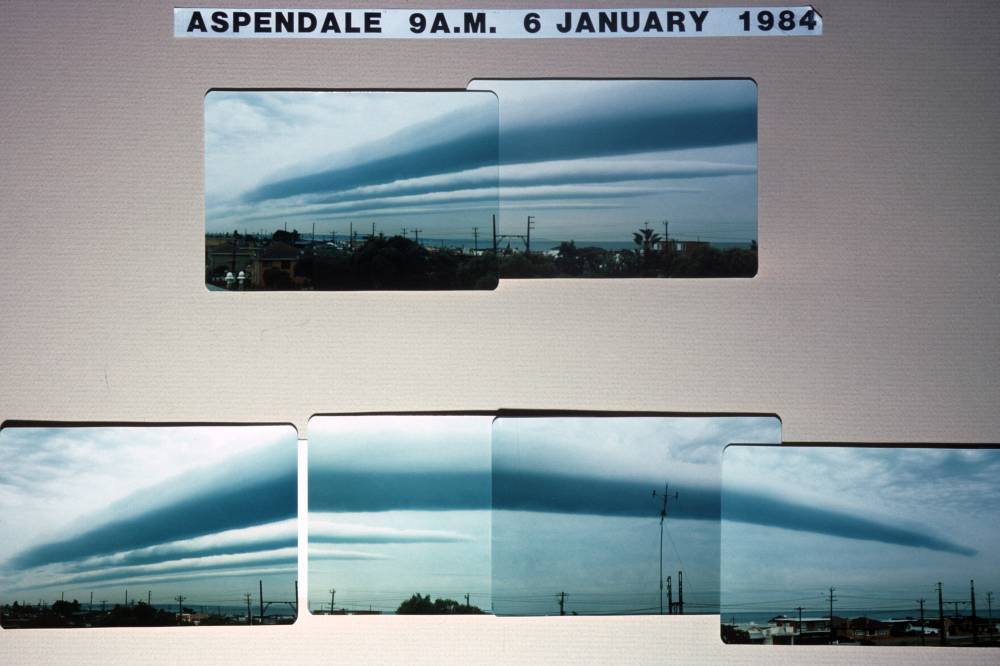
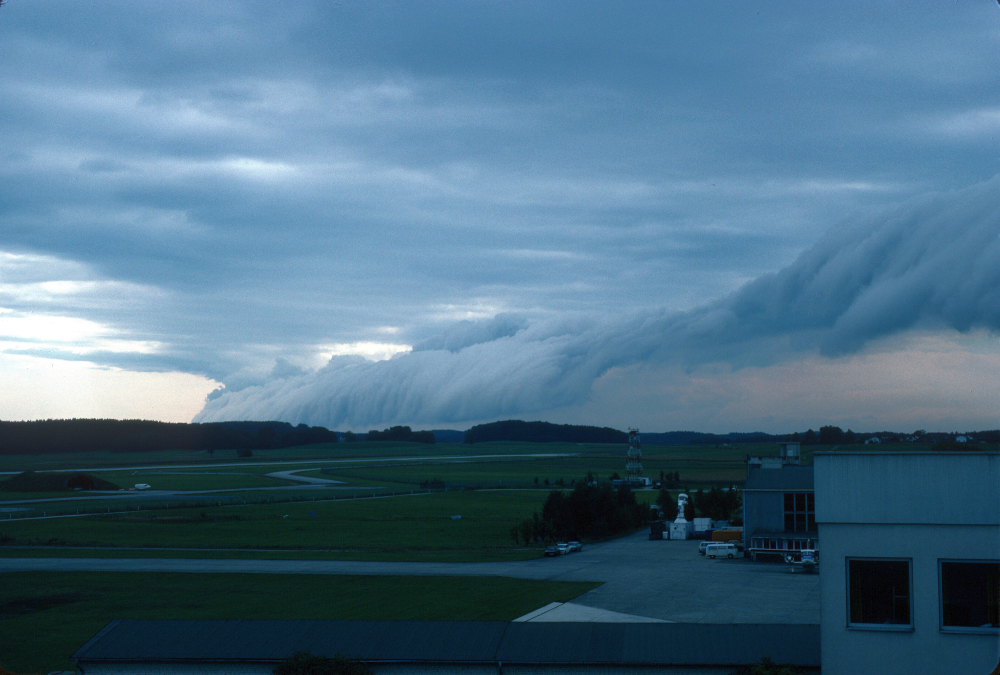
A question that is often asked is whether morning-glory-like disturbances occur elsewhere in the World? The answer is yes, but as far as we know, not with such regularity. Examples of events documented in the literature include one in Oklahoma (Haase and Smith 1984), one over the Indian Ocean northwest of Western Australia (Smith 1987), one in Melbourne (Physick 1986) - see Fig. 22a, and one in southern Bavaria (Hoinka and Smith 1988) - see Fig. 22b. Schmidt and Goler (2010) investigated nonlinear waves associated with cold fronts in the Great Australian Bight and found that if there is sufficient moisture at low levels and the amplitude of the waves are large enough, the nonlinear waves become visible as a series of long roll clouds resembling the morning glory of the Gulf of Carpentaria region. Significantly, the disturbances described by Physick (1986) and Hoinka and Smith (1988) both occurred ahead of cold fronts.
 (a) (a)
|
 (c) (c)
|
Review articles
R. K. Smith, 1988: Waves and bores in the lower atmosphere: the ´morning glory´ and related phenomena. Invited review paper. Earth Sci. Rev., 25, 267-290.
Christie DR. 1992. The morning glory of the Gulf of Carpentaria: a paradigm for nonlinear waves in the lower atmosphere. Aust. Meteor. Mag., 41, 21-60.
M. J. Reeder and R. K. Smith, 1998: Mesoscale meteorology in the Southern Hemisphere. Chapter 5 of Meteorology of the Southern Hemisphere. Ed. D. J. Karoly and D. Vincent. American Meteorological Society Monograph, No. 49, 201-241.
References on the morning glory
Christie, D. R., K. J. Muirhead and A. L. Hales, 1978: On solitary waves in the atmosphere. J. Atmos. Sci., 35, 805-825.
Christie, D. R., K. J. Muirhead and A. L. Hales, 1979: Intrusive density flows in the lower troposphere: a source of atmospheric solitons. J. Geophys. Res., 84, 4959-4970.
Christie, D. R., K. J. Muirhead and R. H. Clarke, 1981: Solitary waves in the lower atmosphere. Nature (in press).
Clarke, R. H., 1965: Horizontal mesoscale vortices in the atmosphere. Aust. Meteor. Mag., 50, 1-25.
Clarke, R. H., 1972: The morning glory: an atmospheric hydraulic jump. J. Appl. Meteor., 11, 304-311.
Clarke, R. H., R. K. Smith and D. G. Reid, 1981: The Morning Glory of the Gulf of Carpentaria: an atmospheric undular bore. Mon. Wea. Rev., 109,1726-1750.
Clarke, R. H., 1983a: Fair weather nocturnal wind surges and atmospheric bores.Part I: Nocturnal wind surges. Aust. Meteor. Mag., 31, 133-145.
Clarke, R. H., 1983b: Fair weather nocturnal wind surges and atmospheric bores. Part II: Internal atmospheric bores in northern Australia. Aust. Meteorol. Mag., 31, 147-160.
Clarke, R. H., 1984: Colliding sea-breezes and the creation of internal atmospheric bore waves: two dimensional numerical studies. Aust. Meteorol. Mag., 32, 207-226.
Goler, R. A., and M. J. Reeder. 2004: The generation of the morning glory. J. Atmos. Sci., 61, 1360-1376.
Goler, R., M. J. Reeder, R. K. Smith, H. Richter, S. Arnup, T. Keenan, P. May, and J. Hacker, 2006: Low-level convergence lines over northeastern Australia. I. The North Australian Cloud Line. Mon. Wea. Rev., 134, 3092-3108.
Jackson, G. E., R. K. Smith and T. Spengler, 2002: The prediction of low-level mesoscale convergence lines over northeastern Australia. Aust. Meteor. Mag., 51, 13-23.
Menhofer, A., R. K. Smith, M. J. Reeder and D. R. Christie, 1997: "Morning Glory’ disturbances and the environment in which they propagate. J. Atmos. Sci., 54 , 1712-1725.
Menhofer, A., R. K. Smith, M. J. Reeder and D. R. Christie, 1997: The bore-like character of three morning glories observed during the Central Australian Fronts Experiment. Aust. Met. Mag., 46, 277-285.
Neal, A. B., I. J. Butterworth and K. M. Murphy, 1977a: The morning glory. Weather, 32, 176-183.
Nudelman, I., R. K. Smith, and M. J. Reeder, 2010: A climatology of pressure jumps around the Gulf of Carpentaria. Aust. Meteor. and Ocean. Journl., 60, 91-101.
Noonan, J. A., and R. K. Smith, 1985: Linear and weakly nonlinear internal wave theories applied to ´morning glory´ waves. Geo. Astro. Fluid Dyn., 29, 123-143.
Noonan, J. A., and R. K. Smith, 1986: Sea breeze circulations over Cape York Peninsula and the generation of Gulf of Carpentaria cloud line disturbances. J. Atmos. Sci., 43, 1679-1693.
Noonan, J. A., and R. K. Smith, 1987: The Generation of the North Australian Cloud Line and the ´Morning Glory´. Aust. Met. Mag., 35, 31-45.
Reeder, M. J., D. R. Christie, R. K. Smith and R. Grimshaw, 1995: Nonlinear waves and bores over northern Australia. Bull. Amer. Meteor. Soc., 123, 1165-1171.
Reeder, M. J., R. K. Smith, D. J. Low, J. Taylor, S. J. Arnup, L. Muir, and G. Thomsen. 2013: Diurnal-Forced Convergence Lines in the Australian Tropics Quart. J. Roy Met. Soc. (in early view).
Royal Australian Air Force, 1942: Weather on the Australia Station. R.A.A.F. Publ. No. 252, 2, part 2, 25-26.
Smith, R. K., and J. Goodfield, 1981: The Morning Glory Expedition. Weather, 36, 130-136.
Smith, R. K., N. Crook and G. Roff, 1982: Morning Glory: an extraordinary atmospheric undular bore. Quart. J. Roy. Met. Soc., 198, 937-956.
Smith, R. K., and B. R. Morton, 1984: An observational study of northeasterly ´Morning glory´ wind surges. Aust. Met. Mag., 32, 155-175.
Smith, R. K., and M. A. Page, 1985: ´Morning glory´ wind surges and the Gulf of Carpentaria cloud line of 25-26 October 1984. Aust. Met. Mag., 33, 185-194.
Smith, R. K., M. J. Coughlan and J. Evans-Lopez, 1986: Southerly nocturnal wind surges and bores in northeastern Australia. Mon. Wea. Rev., 114, 1501-1518.
Smith, R. K., and J. A. Noonan, 1998: On the generation of low-level mesoscale convergence lines over northeastern Australia. Mon. Wea. Rev. 126, 167-185.
Smith, R. K., M. J. Reeder, H. Richter, and P. May, 2006: Low-level convergence lines over northeastern Australia. I. Southerly disturbances. Mon. Wea. Rev., 134, 3109-3124.
Thomsen, G., and R. K. Smith, 2006: Simulations of low-level convergence lines over northeastern Australia. Quart. J. Roy. Met. Soc., 132, 691-707.
Thomsen, G. L., and R. K. Smith, 2008: The importance of the boundary layer parameterization in the prediction of low-level convergence lines. Mon. Wea. Rev. 136, 2173-2185.
Weinzierl, B., R. K. Smith, M. J. Reeder, and G. Jackson, 2007: MesoLAPS predictions of low-level convergence lines over northeastern Australia. Wea. Forecasting, 22, 910-927.
References on related topics
Related theory
Haase, S. P., and R. K. Smith, 1989a: The numerical simulation of atmospheric gravity currents. Part I. Neutrally-stable environments. Geo. Astro. Fluid Dyn., 46, 1-33.
Haase, S. P., and R. K. Smith, 1989b: The numerical simulation of atmospheric gravity currents. Part II. Environments with stable layers. Geo. Astro. Fluid Dyn., 46, 35-51.
Physick, W. L., 1986: Observations of a solitary wave train in Melbourne, Australia. Aust. Met. Mag., 34, 163-72.
Related phenomena
Haase, S., and R. K. Smith, 1984: ´Morning glory´ wave clouds in Oklahoma: a case study. Mon. Wea. Rev., 112, 2078-2089.
K. P. Hoinka and R. K. Smith, 1988: A dry cold front in southern Bavaria. Weather, 43, 255-260.
Holland, G. J., J. L. McBride, R. K. Smith, D. Jasper and T. Keenan, 1986: The BMRC Australian Monsoon Experiment: AMEX. Bull. Amer. Met. Soc., 67, 1466-1472.
Drosdowsky, W., and G. J. Holland, 1987: North Australian cloud lines. Mon. Wea. Rev., 115, 2645-2659.
Drosdowsky, W., G. J. Holland and R. K. Smith, 1989: Structure and evolution of North Australian cloud lines during AMEX Phase I. Mon. Wea. Rev., 117, 1181-1192.
Schmidt, C. W., and R. A. Goler, 2010: Nonlinear waves ahead of fronts in the Great Australian Bight. Mon. Wea. Rev., 138, 3474-3496.
Smith, R. K., 1986: ´Evening Glory´ wave-cloud lines in northwestern Australia. Aust. Met. Mag., 34, 27-33.
Glossary
Copyright © Roger Smith, Date 06 February 2015