Radar remote sensing of clouds and precipitation at three wavelengths
14.07.2025
At the Meteorological Institute of LMU Munich, we recently installed two additional cloud radars with different wavelength next to our existing scanning cloud radar (more regarding measurement platform). The KaMACS cloud radar with a wavelength of 8 mm is now completed by WMACS with 3mm and XMACS with 3cm wavelength.
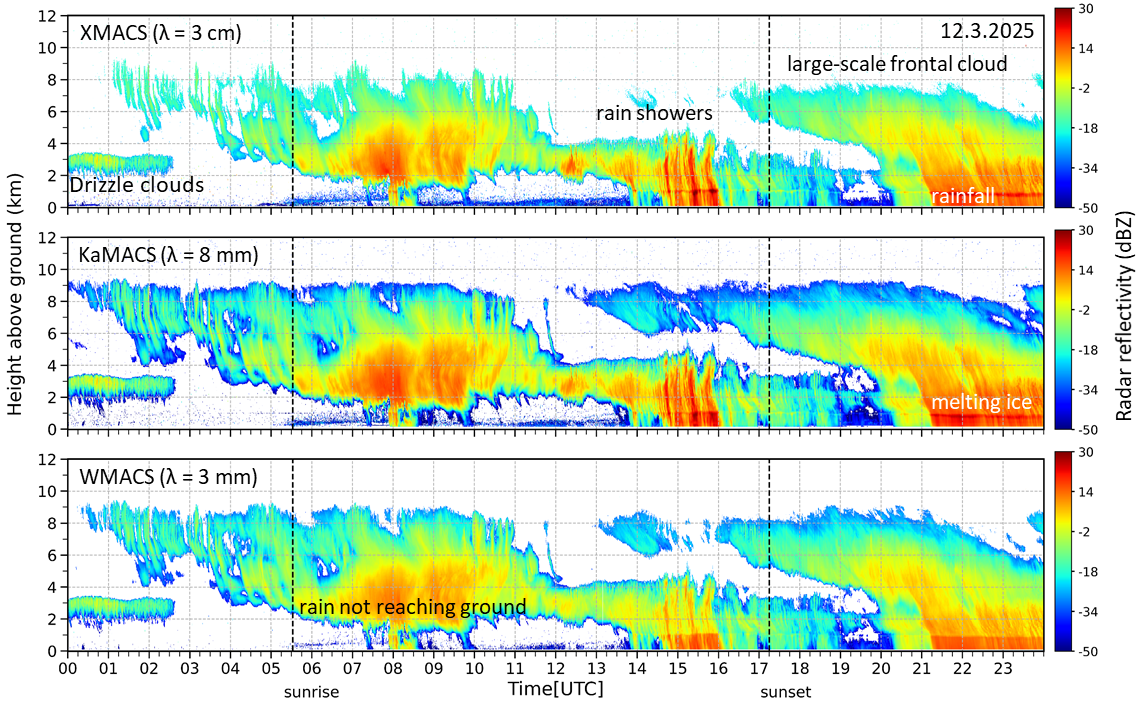
The top image shows a day in March when a frontal disturbance moved through the Munich area throughout the whole day with included showers before the main precipitation passes after 21 UTC. The quantitative differences in sensitivity between the three radars become visible. Nonetheless qualitatively the main features are there in all observations as all three radars belong to the family of "cloud radars" sensitive to cloud and precipitation particles. This is opposed to "precipitation radars" which are used by weather service networks to detect precipitation fields (and only them) over long distances.
While radars with shorter wavelength are more sensitive to smaller ice particles and droplets, their signals are also more attenuated in intense rainfall. The radar with larger wavelength, on the other hand, is able to observe the entire cloud even in situations of heavy rainfall (up to ca. 80 mm/hr). The combination of three wavelength also allows us to derive the size of raindrops and snowflakes because they scatter the radar waves in different ways and hence produce characteristically different signals.
We also can scan with some cloud radars while one will always collect the zenith-view obserrvations (for long-term statistics). From these scans, we can for example derive wind speed and direction inside the cloud, but can also look at the spatial structure of clouds and precipitation. Also polarimetric signatures of differently shaped ice crystals (plates, needles, columns) can only be captured by pointing the antenna slant.
Checkout more observations in our Data Browser (look for "3radar" or the acronyms WMACS, KaMACS, XMACS). We also make measurement data available to the international research community (link: Cloudnet) as part of the EU infrastructure project ACTRIS (www.actris.eu). Standardised cloud parameters are derived from the measurements of numerous other European stations. They enable long-term statistical analyses of cloud processes, which in turn provide an important prerequisite for the long-term improvement of weather and climate models.
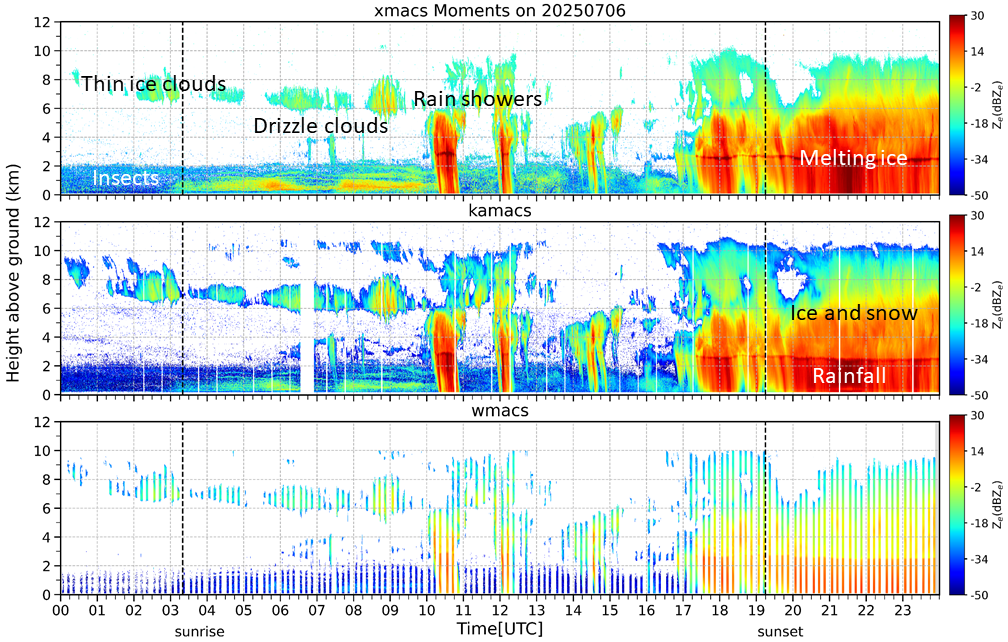
The bottom example shows another case on 6.July.2025. A summer case with convective showers, a prominent "melting layer" and a surprisingly large amount of insects up to 2 km height just below freezing (melting) height. They are best visible in the XMACS data with the longest wavelength pointing to the fact that their size is itself in the range of one to several centimeters. The striping in the bottom WMACS image is a result of regular scanning activity, i.e., times when the radar is not pointing vertical.